
BTCUSD (Coinbase)
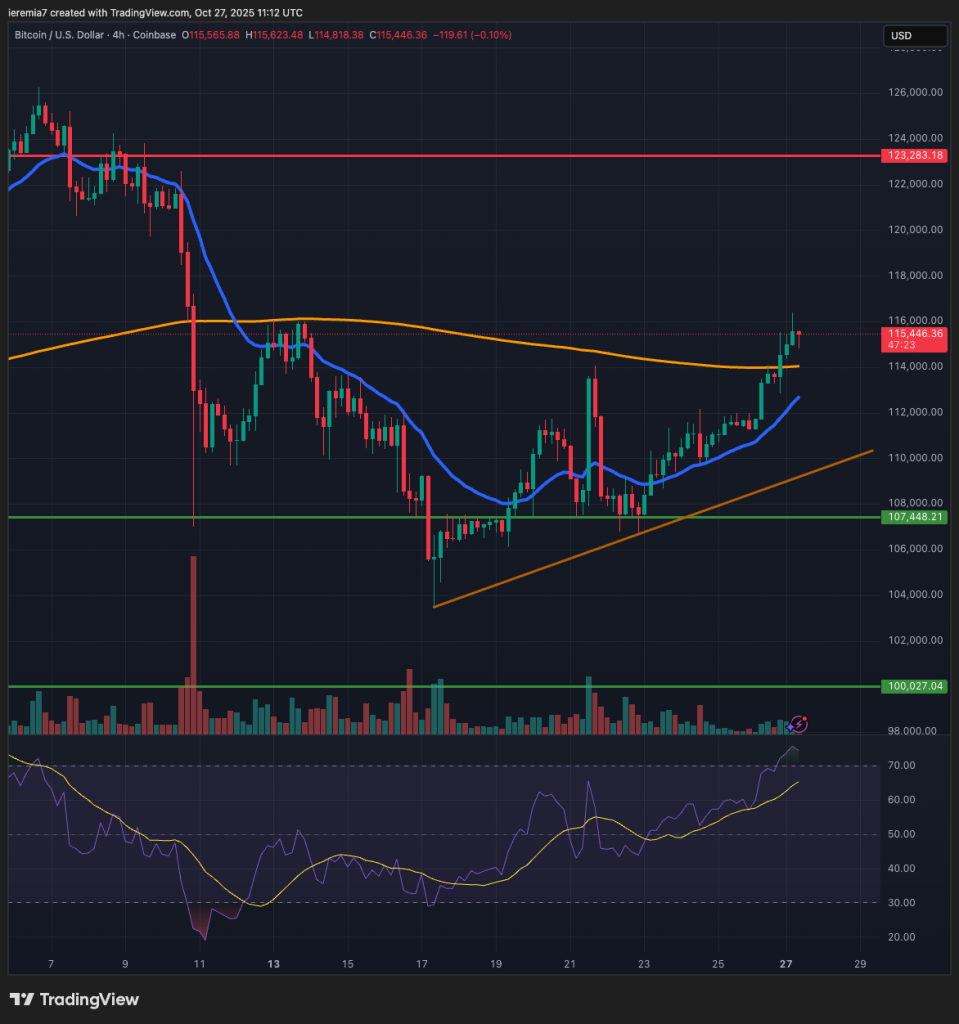
Bitcoin sentiment is improving to start the new week on easing tensions between China and the US. The price has breached above the $114k area, a prior swing high, suggesting buyers are willing to step in, even at higher prices.
Looking at the 4h chart, the price has also breached above the 200 SMA and for that matter, we give an edge to buyers this week. However, traders should consider the FOMC on Wednesday and the Trump – Xi summit on Thursday, since those events can lead to volatility.
If positive expectations will materialize, Bitcoin has potential to end October on a strong footing and enter November, one of the most bullish months of the year, well positioned to tackle the all-time high. Our current upside target is around $123k, but a break higher shouldn’t be excluded, barring the market won’t have to price in major negative headlines.
We see support around $110k and $107k, should negative sentiment return. Buyers hold the upper hand at this stage and given has been an underperformer for weeks, this might be the opportunity bulls have been waiting for.
ETHUSD (Kraken)
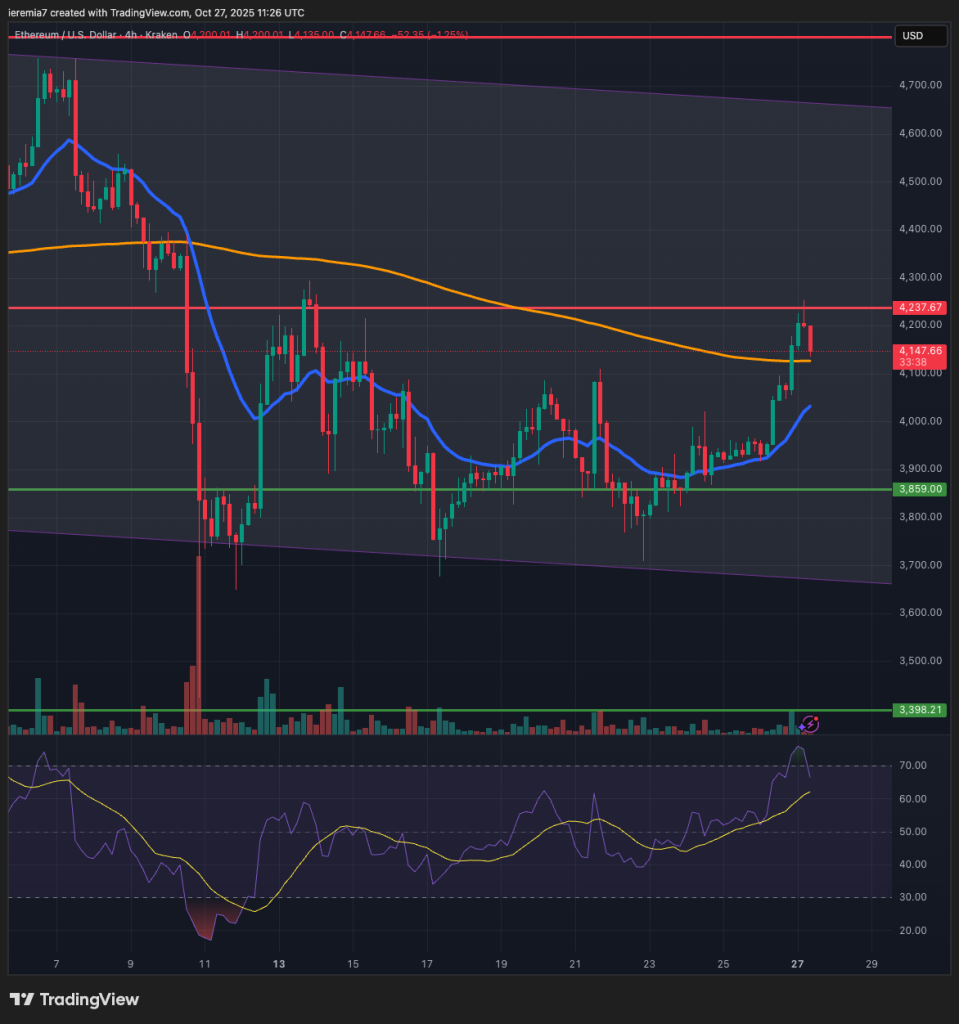
Ether displays a similar bullish parabolic structure as we see with Bitcoin, suggesting the buying is broad-based, not reserved to a couple of coins. That gives hope for the days ahead, since it could lead to further gains. So far, the market is reacting to our $4,230 key resistance level and we expect support around $4,100.
As long as we stay above the 20 EMA on the 4h chart, we think the bullish momentum will be intact. Breaking above $4,300 will be the bullish confirmation that many buyers are waiting for. Should that materialize, we expect more gains into the $4,600 area.
Breaking below $4,100 will be a slightly negative signal and could mean some short-term weakness towards the $4,000 – $3,900. We see little downside at this point, but as already stated, you should monitor the key events later in the week.
XRPUSD (Kraken)
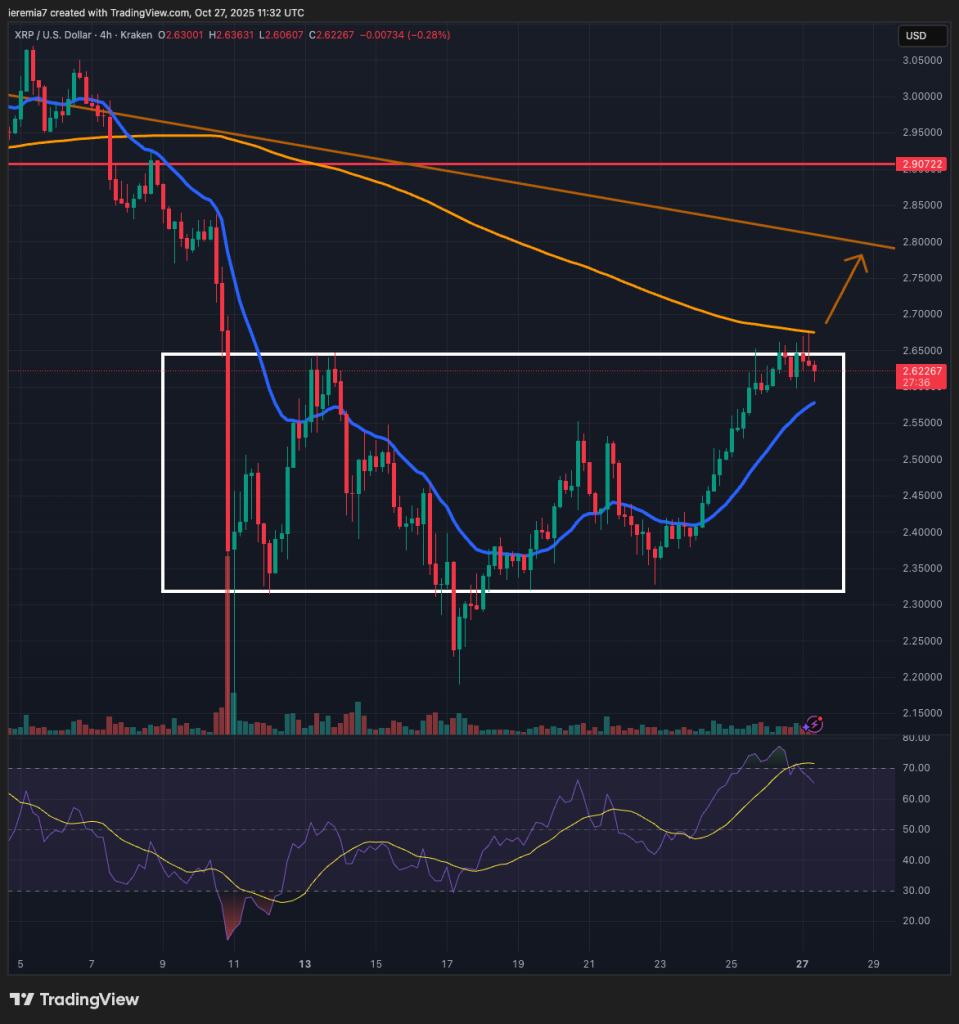
Since the October 10th selloff, XRP has been locked inside the range between $2.65 and $2.30. At the time of writing, the price action is testing the upper side of that zone and we see sellers gaining some short-term momentum.
Still, selling looks contained thus far and the price continues to float above the 4h chart 20 EMA. As long as it keeps above the blue line and above the $2.55 short-term support, we’ll keep a bullish stance, expecting a break to the upside.
In this scenario, we expect XRP to move towards $2.8, where a bearish trend line can be located. Only if the price breaks below $2.5 should we expect further range-bound movement. We don’t think the price will weaken towards $2.3 soon. That would be the likely scenario only if there is a new risk event dampening the bullish appetite and at this stage, that’s not the case.


There are no comments at the moment, do you want to add one?
Write a comment