
BTCUSD (Coinbase)
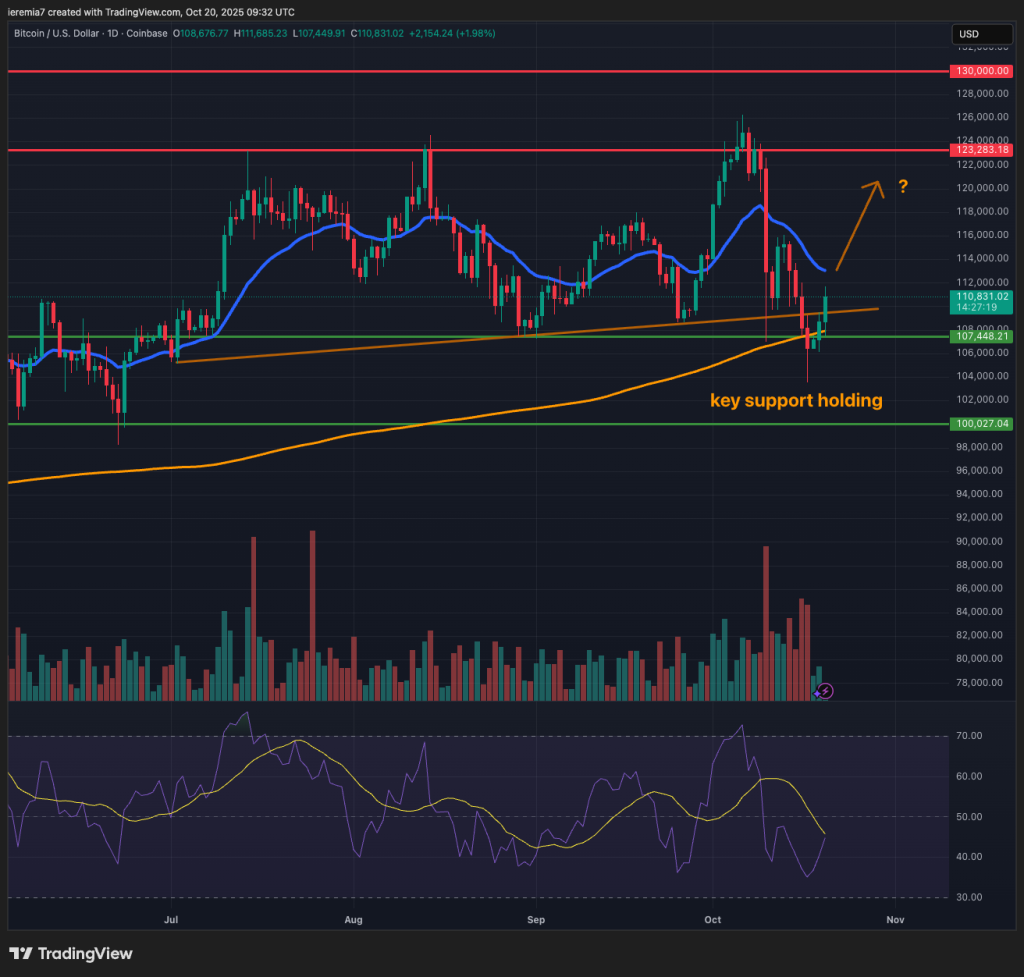
Even though the selling continued last week, we can see how the area around the daily 200 SMA managed to act as support. We highlighted last week that breaking and holding below would be a bearish sign, so since that hasn’t materialized, our expectations for the next few weeks have improved.
Up would be the path of least resistance if the market won’t have to price in negative trade-related headlines again. Tensions have eased and combined with favorable seasonality, we suspect the recovery will continue.
Our stance will stay bullish as long as the current October lows aren’t exceeded. The near-term resistance comes at the daily 20 EMA and if selling is weak there, the leg up will likely extend. The upside target reachable within a couple of weeks is $123k, which is not far from the all-time high.
Renewed selling and a lower low below $104k would be bad news for buyers and could suggest further weakness into the $100k major support zone. All options are on the table and given what we saw a week ago, an open mind is needed even if the upside is favored.
ETHUSD (Kraken)
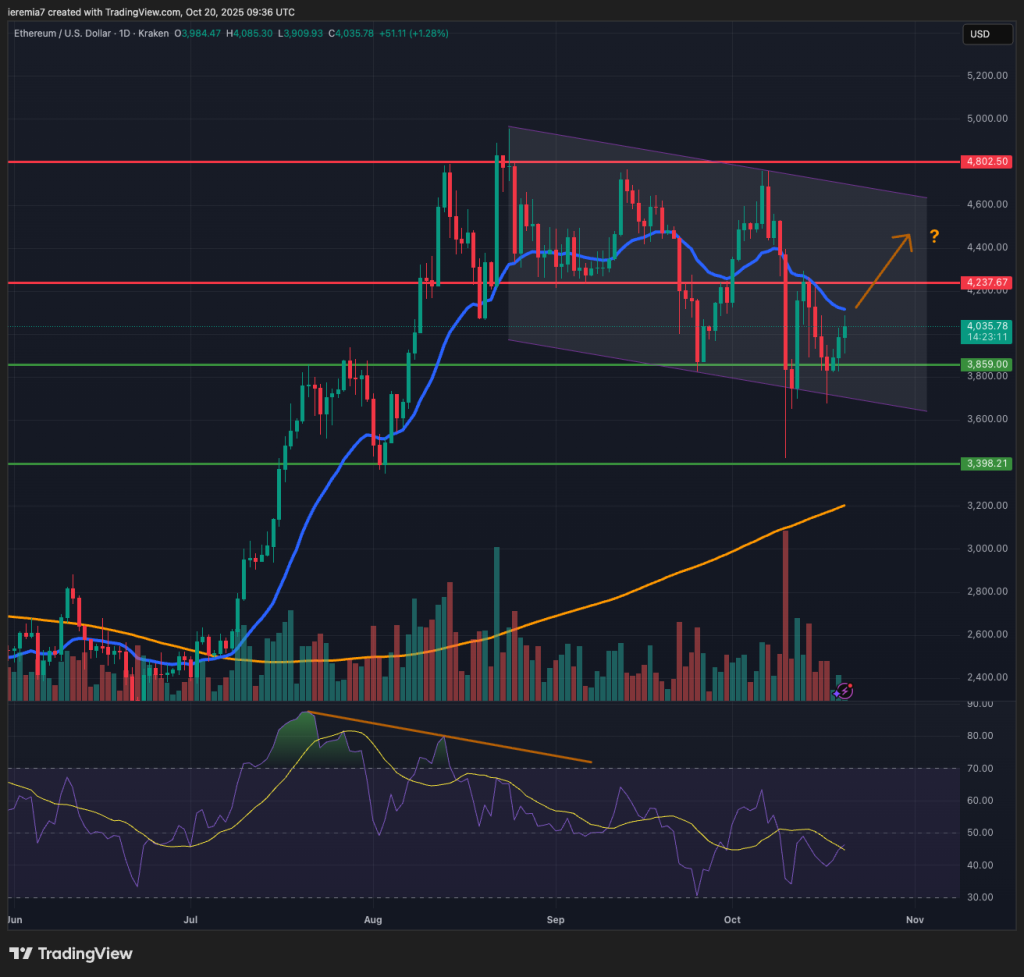
The technical picture looks better in Ether, given that the consolidation channel is respected by the market. ETH jumped after the liquidation selloff, found resistance at the daily 20 EMA, retraced towards the channel and is now rising again.
Let’s see if the 20 EMA + $4,250 will act as a strong resistance again. Weak selling there would be an early sign suggesting buyers are regaining control of the order flow. We favor an extension higher towards the $4,500 – $4,600 where the top of the channel is currently located.
At this point, shorts are not favored since we are not far from major support. However, a major negative headline can, at any point, dampen sentiment, and in that case, we would look for weakness towards $3,400. Still, we give a slight edge to our upside scenario.
LTCUSD (Coinbase)
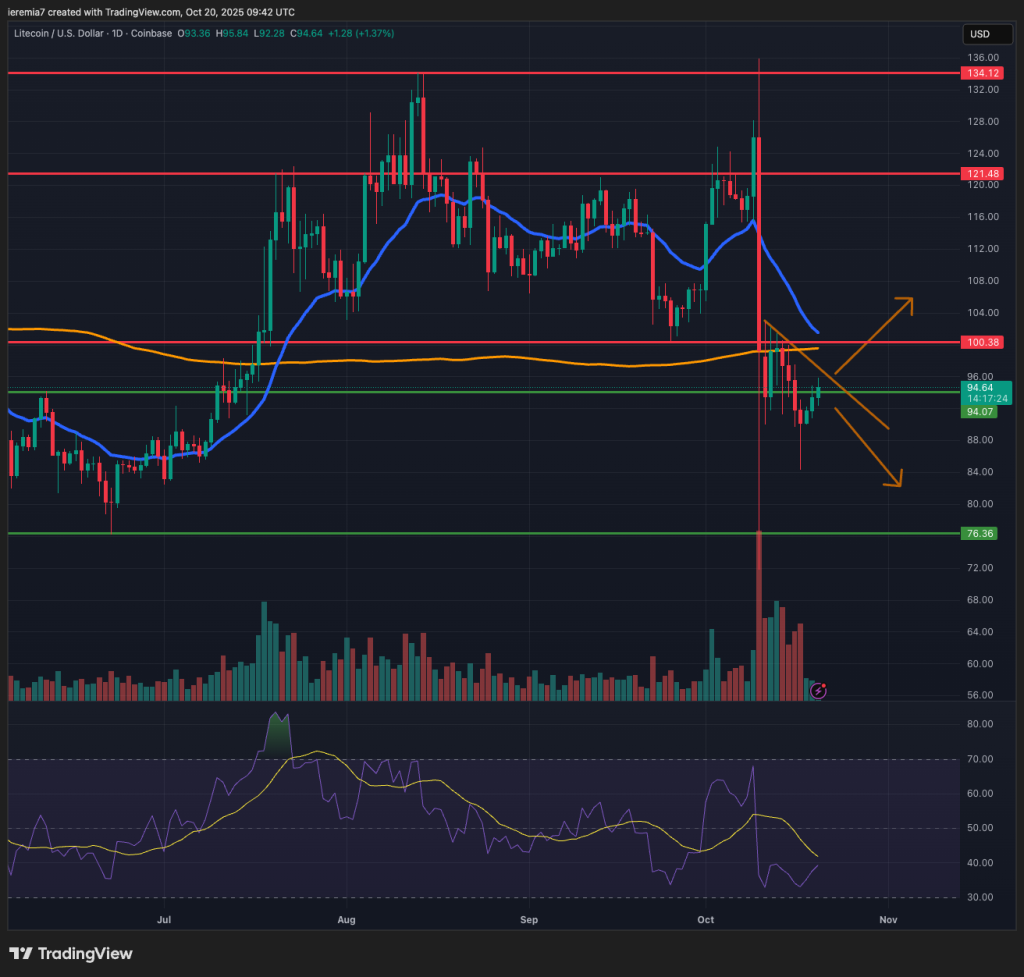
Litecoin suffered a major blow on October 10th, when it tanked 46%. Since then, price volatility has dropped and we are now seeing a bottoming attempt. The price is still unable to break above the daily 200 SMA, but sellers are also weak thus far.
We have drawn a short-term trend line on the chart and if that gets breached, we expect further gains above $100. Failure to break it might mean renewed selling pressure. The path ahead also depends on what happens across the entire market.
If the recovery continues across the board, then Litecoin should follow a similar path. In this case, we see the same exhausted selling followed by weak price volatility, suggesting at least a meaningful correction higher should follow.
At this point, we can’t suggest the market will go to new highs before year’s end, but we do think there is room for a recovery by the end of November, in what’s generally dubbed as the Santa Claus rally.


There are no comments at the moment, do you want to add one?
Write a comment