
BTCUSD (Coinbase)
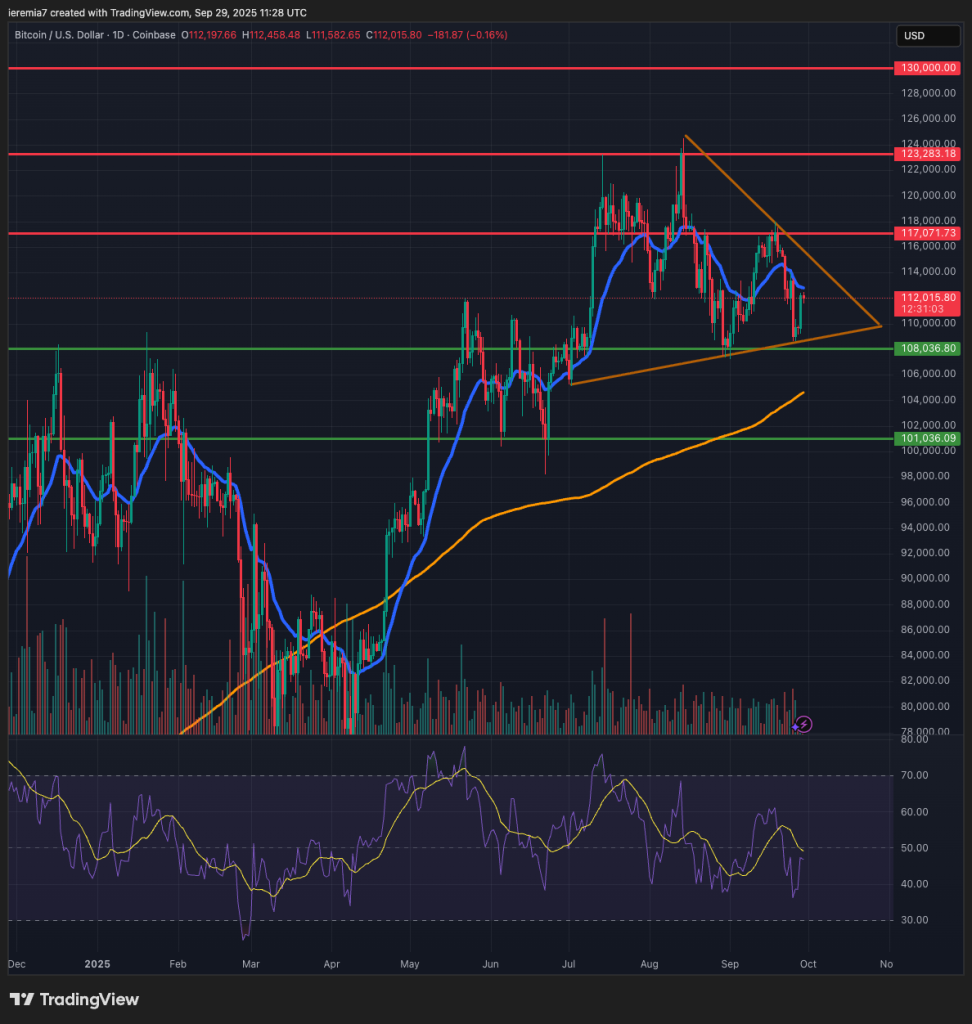
Bitcoin closed lower last week, but managed to recover some ground on Sunday. Looking at the daily chart, we see the price locked inside a triangle formation, which puts us in a wait-and-see mode until a break happens.
Short-term traders can still play both sides of the structure, but only a break outside of it will hint at the next direction. As a result, breaking above will mean $117k and $123k will be back in our spotlight as the main target areas.
To the downside, a breakout below the triangle + $108k will be a bearish sign and will imply a retest of the daily 200 SMA. As long as the selloff is contained, we believe it will turn out as a buying opportunity, since seasonality improves in October and November.
It wouldn’t surprise us if BTC breaks lower, triggers some stop losses and then turns around higher, trapping sellers below. Short-covering could act as a fuel for a rally and confirm once again the bullish expectations for this period of the year. This isn’t a certainty, but it’s definitely a scenario to keep in mind.
ETHUSD (Kraken)
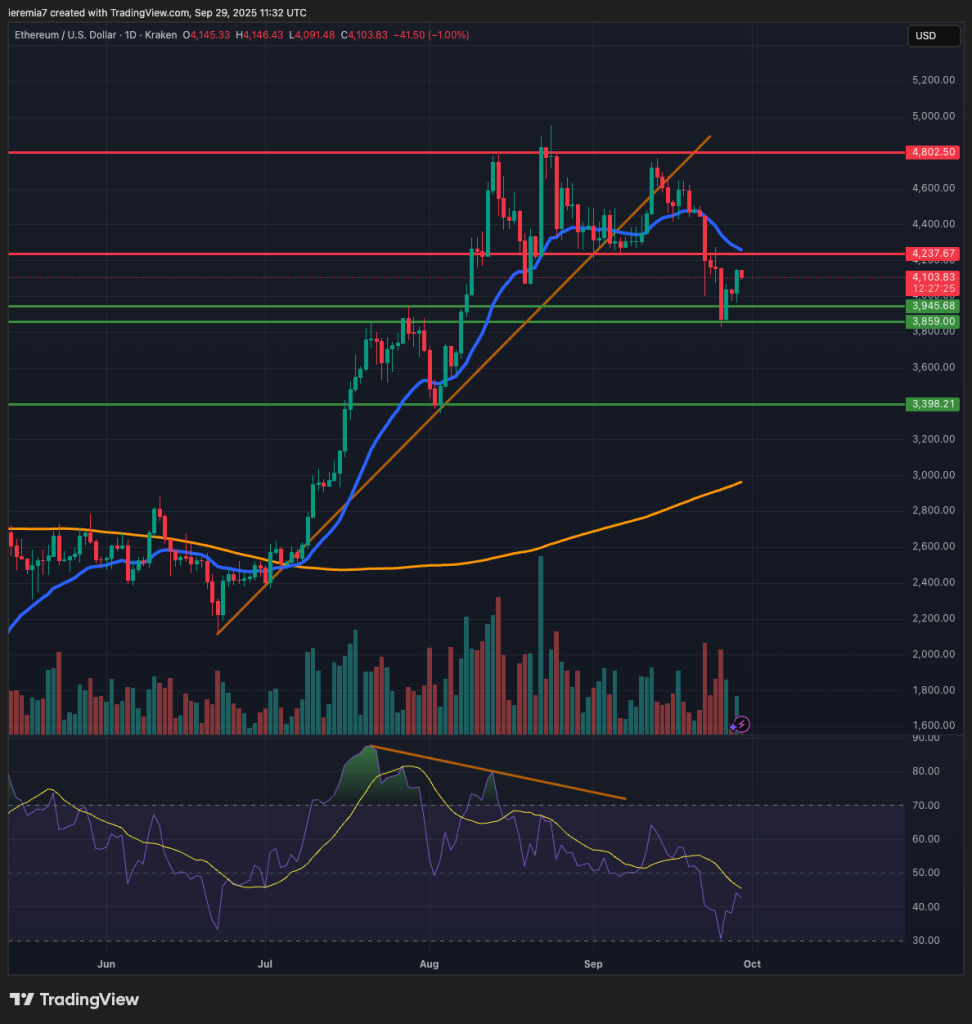
Ether continues to struggle after the price broke below the bullish trend line + daily 20 EMA. However, we see buyers were active again once the price reached the $3950 – $3850 key support area.
Because of that, we’ll treat that zone as support until there is a break below last week’s low. As long as that doesn’t happen, we expect sentiment to improve and the market to recover. The price still has to clear out the daily 20 EMA and the $4,250 resistance and we are confident it can do that eventually.
Short-term pullbacks must be met with bullish strength for our positive expectations to materialize. If so, ETH might be able to get closer to $4,800 before 2025 ends. When the crypto market is bullish for the first 3 quarters, Q4 ends up being bullish most of the time.
XRPUSD (Kraken)
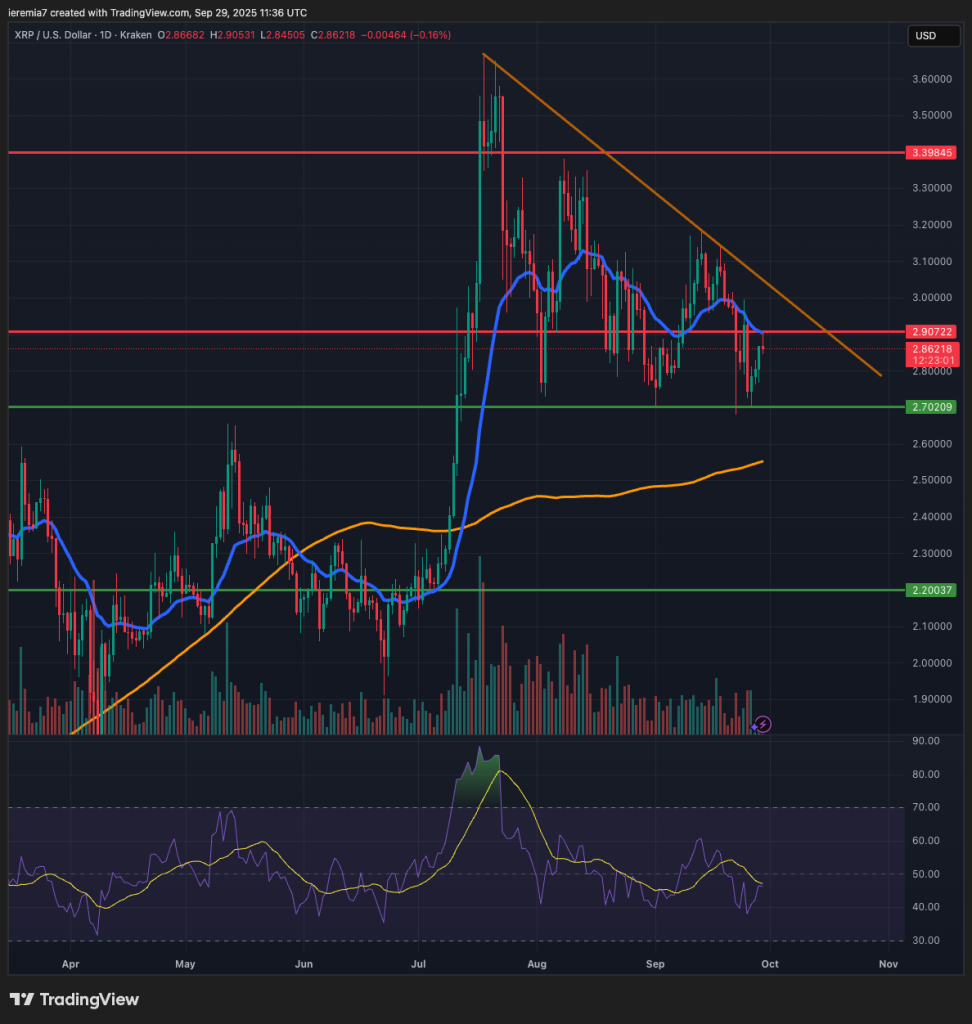
We want to draw our readers’ attention back to XRP because this coin is also locked inside a triangle formation and here, conditions seem even better for buyers. The price seems to have found a floor at $2.7 and if that holds, we might start to see more gains as October starts.
Keep in mind that some players want to trap traders off guard, and for that reason, we can see the price dipping below $2.7 only to recover after that. It’s a reasonable scenario, considering the daily 200 SMA will also act as dynamic support.
Conditions are no longer overbought and if the RSI starts to move up, that will signal an improvement in momentum. Once the triangle is breached to the upside, our target will shift higher to $3.4. If weakness persists and we see lower lows and lower highs, that would be good news for sellers and more losses might come down the road.


There are no comments at the moment, do you want to add one?
Write a comment