
BTCUSD (Coinbase)
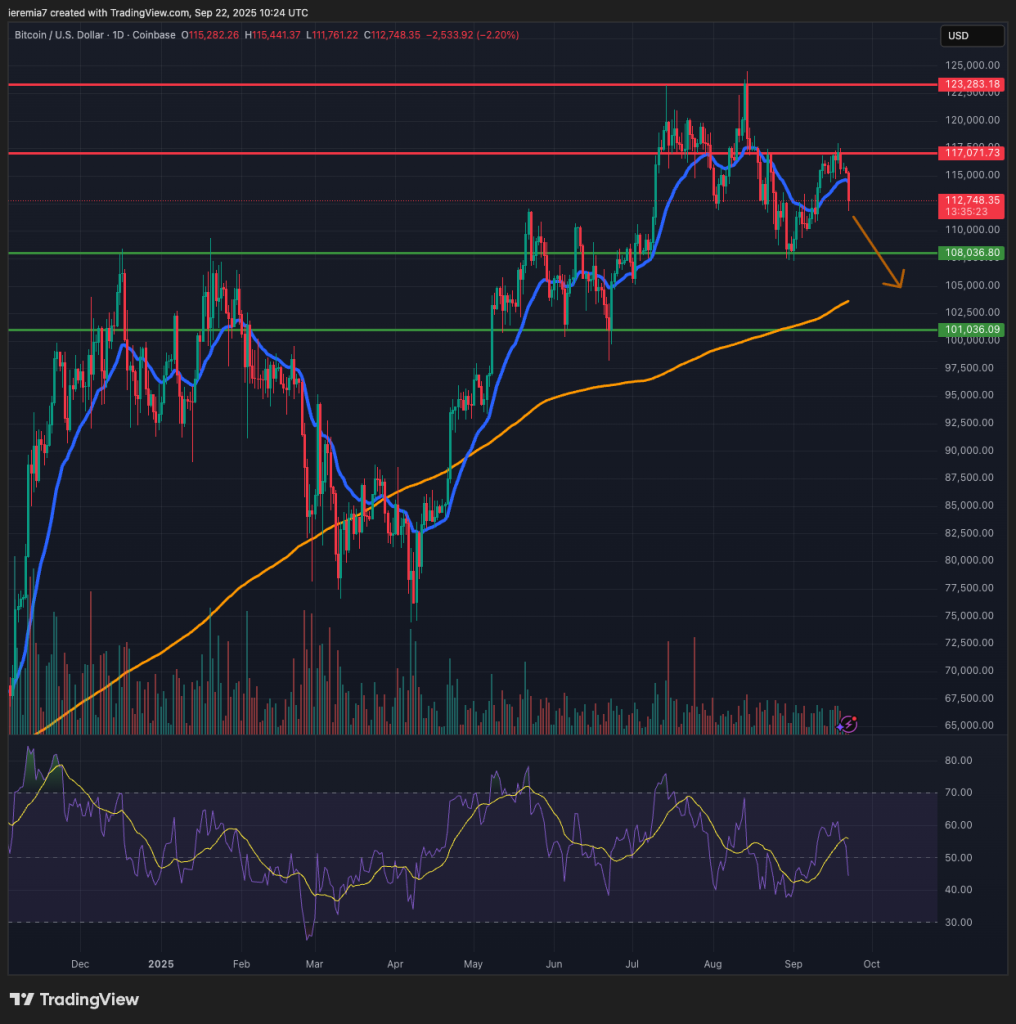
This week starts with Bitcoin under pressure, which is in line with our expectations for weakness into the end of September. The price is back below the daily 20 EMA and that’s not an encouraging sign for bulls. We think selling will continue and our next support target is located at $108k.
Even if some bulls might enter there, we think BTC is poised to retest the daily 200 SMA, which is a stronger support area. Back in April, that’s where a new leg up has started, so it might be the case once more.
Bear in mind that seasonality shifts to bullish around mid-October, meaning the price can fall further until buyers take back control over the order flow. For now, our stance is bearish and we’ll change our approach only if BTC breaks and holds above $118k.
Only once that happens, we will continue a retest of the all-time high, and maybe even new highs. That scenario is still on the table by the end of the year. We say that due to the Santa Claus rally, which usually occurs when BTC has a positive performance by Q3.
ETHUSD (Kraken)
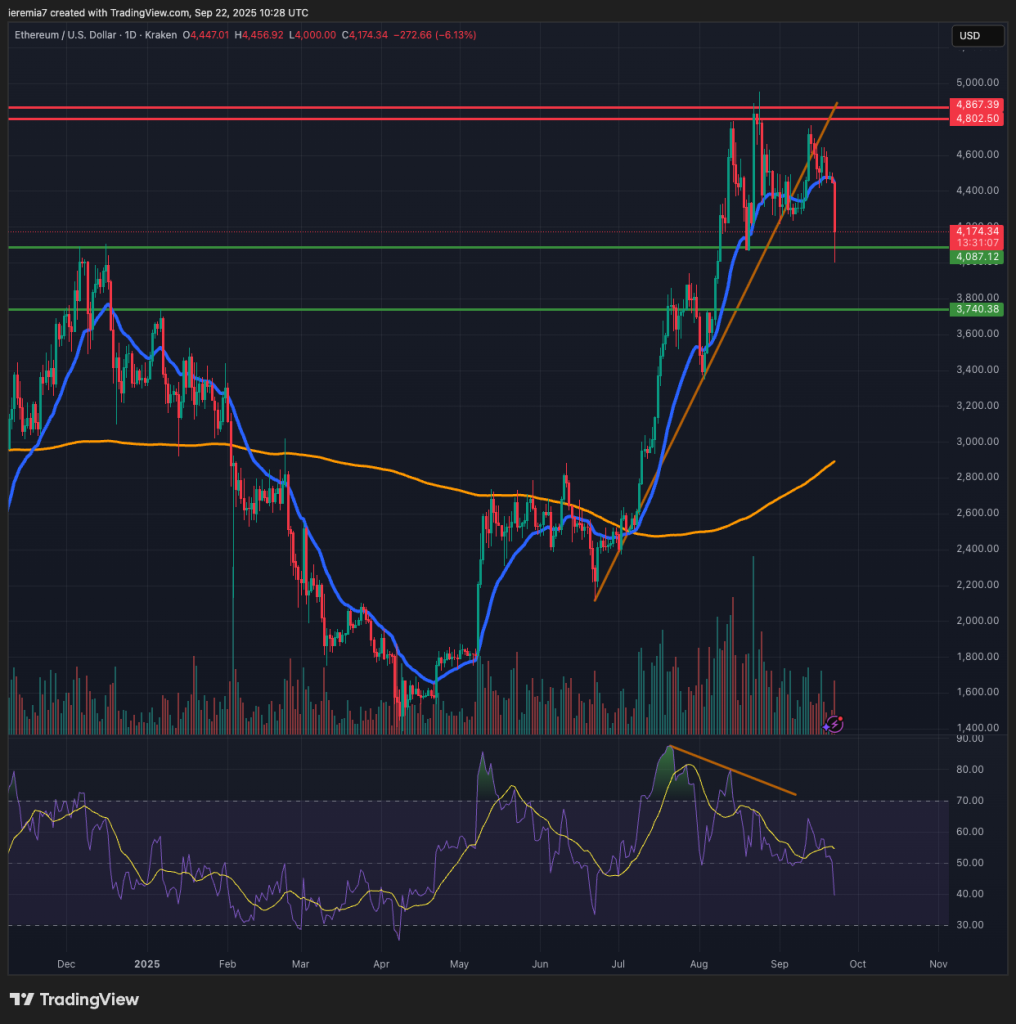
Ether is down 6% for today, more than Bitcoin, suggesting altcoins are witnessing stronger selling pressure. Once the price broke below our bullish trend line, sellers took control and despite a temporary stall around the 20 EMA, they were able to drive the market lower today.
At the time of writing, we are seeing a short-term pullback that unfolded around the December 2024 swing high, which is around $4,080. If the daily candle closes below the level, we think the correction is poised to extend towards $3,700, another important support area.
Current weakness is not enough to negate the broad bullish trend, but it can lead to some further selling before buyers are confident enough to enter the market in force. For that, we would have to see the daily 20 EMA treated as support, instead of resistance, and the RSI edging up.
LINKUSD (Kraken)
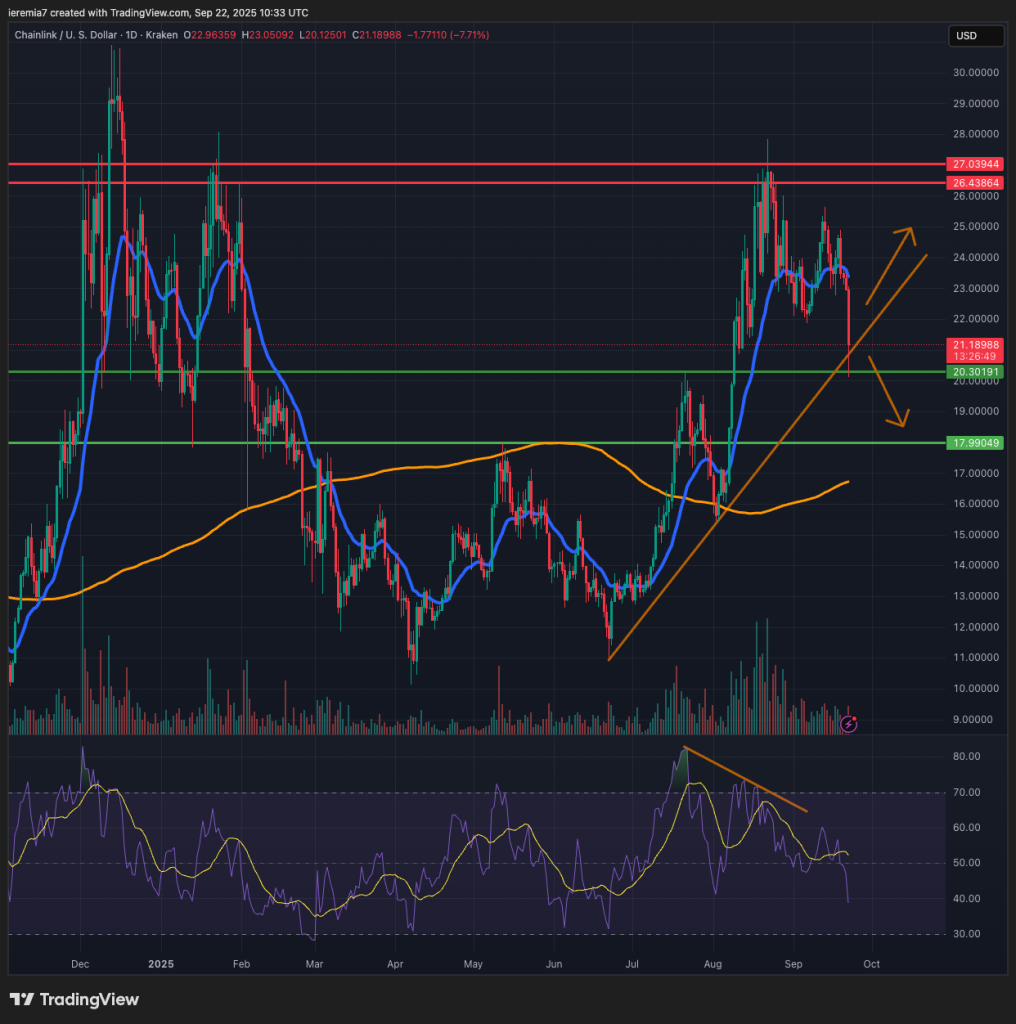
Chainlink is now at a crossroad and what happens during the upcoming days will determine if the market resumes the upside trend or weakens further. The price is retesting an important trend line and so far, buyers have been able to defend it.
We can also see that the $20.3 support level was tested and buyers were able to turn the tide there. However, we are not yet out of the woods, which is why the bearish seasonality makes us believe that selling might continue.
Still, some short-term gains are possible. We see the $22 and $23 levels as places where sellers might consider placing their shorts. Only if the price breaks and holds above the daily 20 EMA should we hope for a leg up into the $26 – $27 resistance area. A break below $20.30 would be a bearish sign and in that scenario, we believe LINK might weaken towards $18, or the daily 200 EMA.


There are no comments at the moment, do you want to add one?
Write a comment