
BTCUSD (Coinbase)
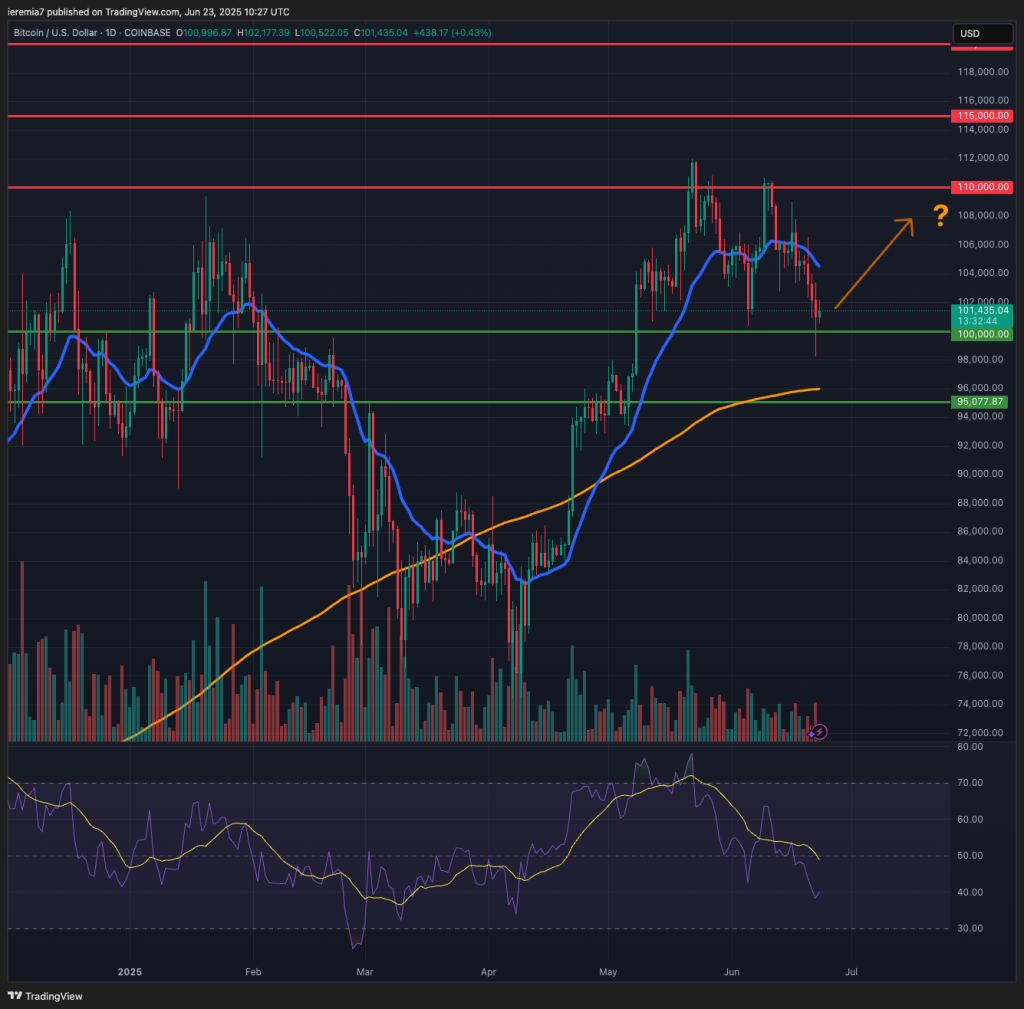
There has been a spike in geopolitical tensions during the weekend, and that has made BTC weaken below $100k. We warned last week that this would be the greatest risk to our bullish forecast and unfortunately, it materialized.
However, thus far, there is no follow-through selling and the $100k seems to act as support. As long as that happens, we should gradually see a recovery during the upcoming days. The first line of resistance is the 20 EMA on the daily chart, which comes at around $104k. Buyers managing to exceed that area would be an encouraging sign.
That’s needed to shift the market’s attention back to $100k. So far, the oil price has weakened from its highs, suggesting the market is not worried about the Middle East situation. Still, the is always a risk of escalation in these situations, so if that happens, we think BTC might weaken further towards the daily 200 SMA and $95k key support area.
Traders also need to consider it’s the last week of the month and the end of the first half, which might bring in some passive sellers willing to take profits off the table.
ETHUSD (Kraken)
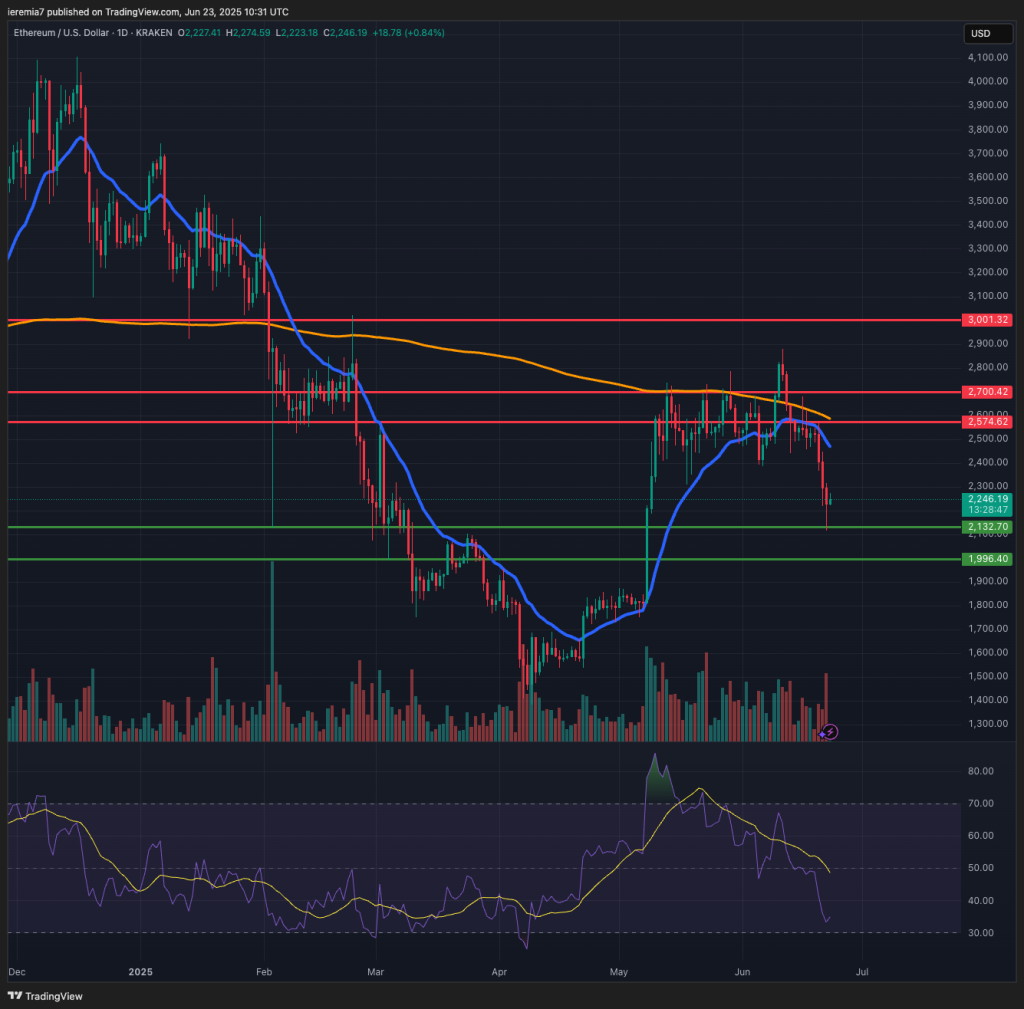
Ether did manage to break above $2,700 again last week, but failed to continue up as geopolitics brought heavy selling back to the picture. The price is now well below our key resistance zone and also below the 200SMA on the daily chart.
Still, the $2,130 level acted as support, showing a willingness to buy on dips. We think that level combined with $2,000 form an important demand zone. Further selling from this point forward should be contained as long as there is relief across all risk assets during the upcoming days.
That’s a possibility, although traders might want to wait a bit more until the price action on lower time frames shows clear signs of bottoming. If that’s the case, the price should move back up towards the $2,500 – $2,700 key resistance zone.
TRXUSD (Bitfinex)
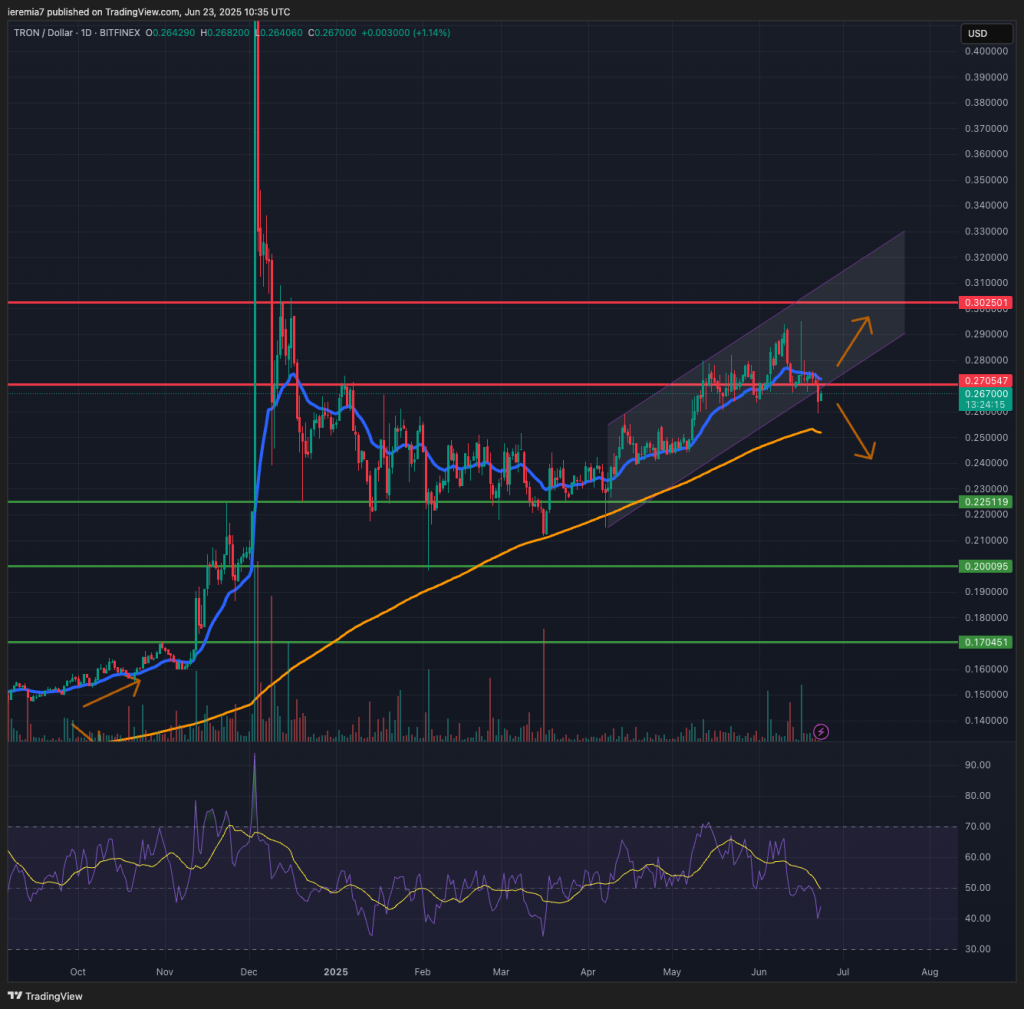
We are bringing TRON back to our weekly analysis because the price seems to have shifted tone as a result of what happened last week. We see a dip and continuation below the daily 20 EMA and at the same time, sellers managed to drive the price below a rising channel.
Both are short-term bearish signals and might suggest more selling ahead. Still, this could end up being a fake bearish break and if that’s the case, we should start to see renewed buying pressure. That will put TRX on track to reach the 30 cents key resistance area.
More selling on the downside will mean the daily 200 SMA comes as the first support. We think the price has more room to go if that dynamic support doesn’t hold. More specifically, 22 cents and 20 cents should be back in focus in case selling intensifies. TRX spiked in December and has been consolidating since then.


There are no comments at the moment, do you want to add one?
Write a comment