
BTCUSD (Coinbase)
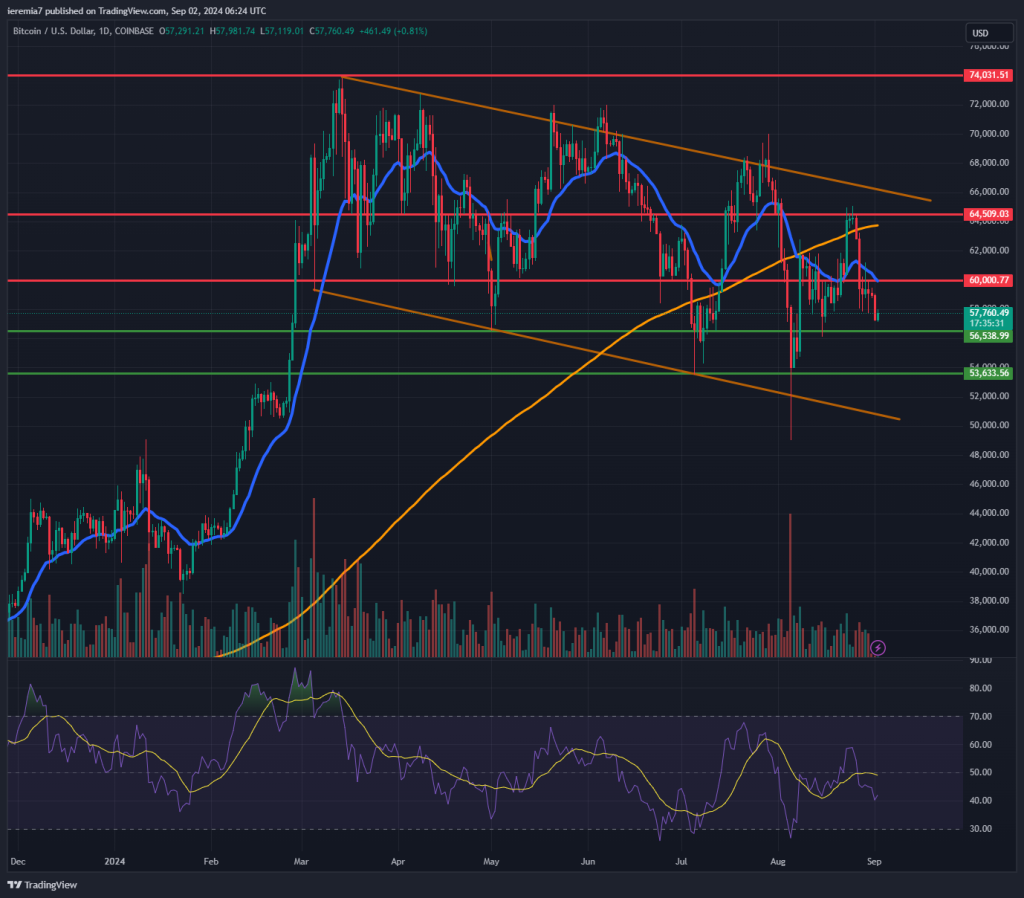
Bitcoin failed to hold above the daily 200 SMA and as we’ve stated in our last weekly analysis, that could be a potential bearish sign. Rightfully so, bears took control and drove the price below $60k which is another important support area.
Things are complicated right now, not just due to technicals, but also since we are entering a period of weakness from a seasonal standpoint. Given only the last 3 months of the year are very positive, bulls might have to wait some weeks until sentiment improves.
Seasonality is not 100% accurate, so we should consider other factors as well. For the time being, BTC is under pressure and we are looking for support around $56.5k. If that doesn’t happen, the next area of support comes around $53k – $52k. Don’t forget the consolidation structure that we’ve talked about for a couple of weeks. That’s still in place and could be a place where BTC bounces.
We would sell rips as long as the price can’t break above the channel. It looks like there is nothing important to energize buyers, so you should be patient. Breaking back above $60k will be the first encouraging sign, but as our chart shows, other resistance levels follow.
ETHUSD (Kraken)
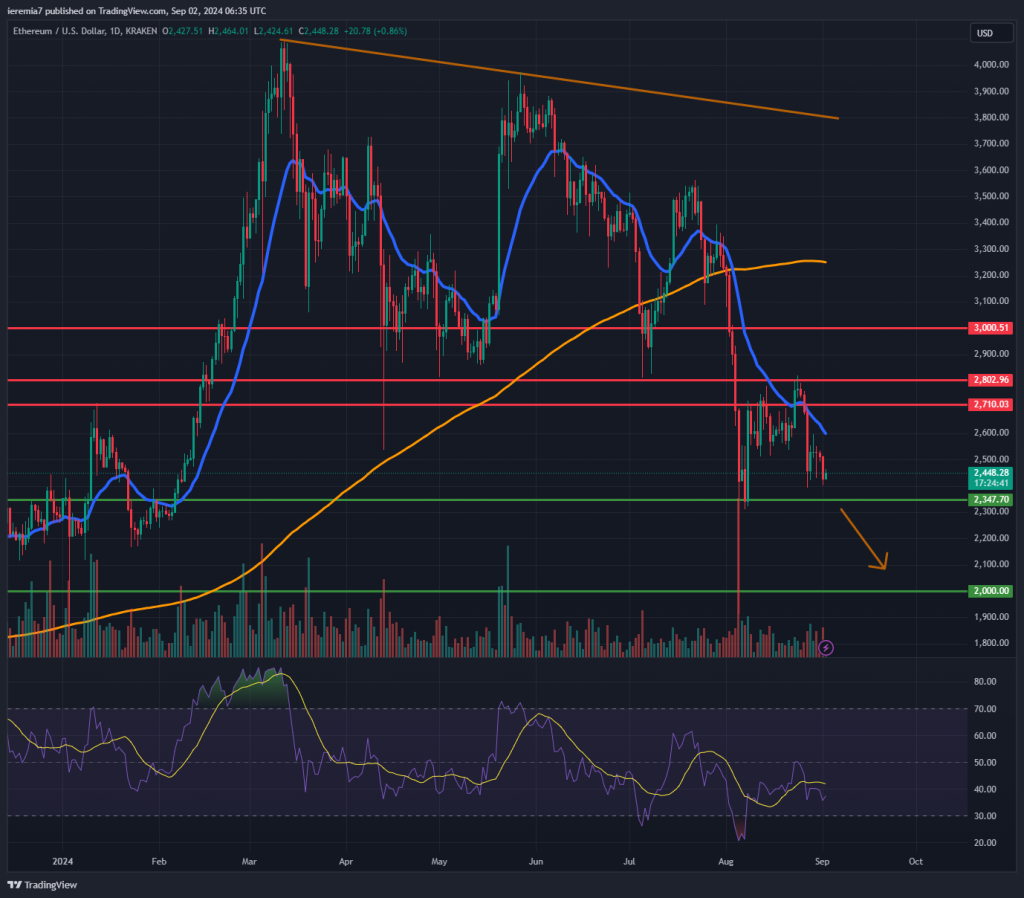
Ether is not looking good either, since the daily 20 EMA turned out to be heavy resistance. The market rejected the blue line on the chart and after that we can only see consistent selling with little reactions from the bulls.
Selling could continue this week and we are looking for temporary support around $2,350. That can easily fail, so the attention will shift to the $2,000 area. That’s a psychological level where more buyers might be willing to step in.
There are no signs of bottoming and that’s a sign for worry, especially for traders who want to take advantage of short-term moves. Longer-term investors should be able to tolerate lower levels before the market rebounds, but for now, we see little reason for a sustained bounce.
ETH needs to break above $2,800 to suggest the sentiment has improved. That could open more room towards $3,000.
BNBUSD (Binance)
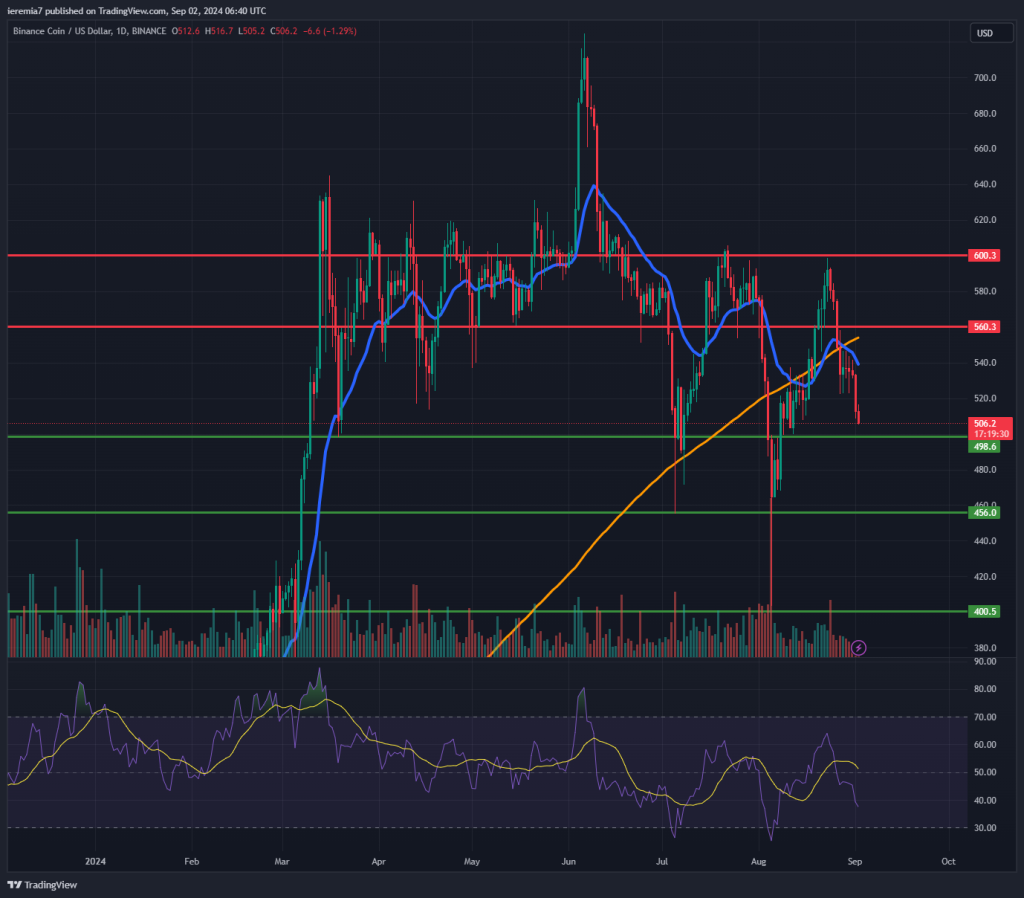
Binance Coin can still be regarded as a gauge of overall market sentiment and as the chart above shows, things are not pretty. Despite a temporary bounce to $600, the market was unable to hold those gains. In fact, we can see consistent selling for over 10 days, which suggests people are dumping BNB.
The first line of support comes at $500, but as things stand, we think the price can pierce through easily. Next is $450, when BNB bounced at the beginning of July. Finally, we want to highlight $400, a bigger support area where the probability for a bounce will be higher.
Overall, the bigger picture suggests a topping formation and that will be the case until the price gets closer to the current 2024 highs. Although BNB had a nice run this year, we would wait for further selling before committing to longs.


There are no comments at the moment, do you want to add one?
Write a comment