BTCUSD (Coinbase)

Unfortunately for buyers, momentum fails to improve as the market continues to treat the daily 20 EMA as resistance, unable to break above it. BTC is usually correlated with the Nasdaq index and this was true last week as well, when tech stocks were under pressure.
We think traders should monitor this correlation as it could continue to drive Bitcoin. Although the RSI is close to oversold territory on the daily chart, we don’t think it’s time for longs, yet. We should see stronger bullish momentum first.
The price broke below the $100k mark and that should be treated as an overhead resistance. Should we break above it again, then we might be able to consider longs. We think a bearish stance will persist as long as BTC trades below $100k and below the falling trend line on our chart.
Further selling from the current level will mean $93k and $89k could be next as support levels. Above the daily 20 EMA, the trend line and $108k are the main resistance zone. All in all, selling has accelerated last week, which dampened our expectations.
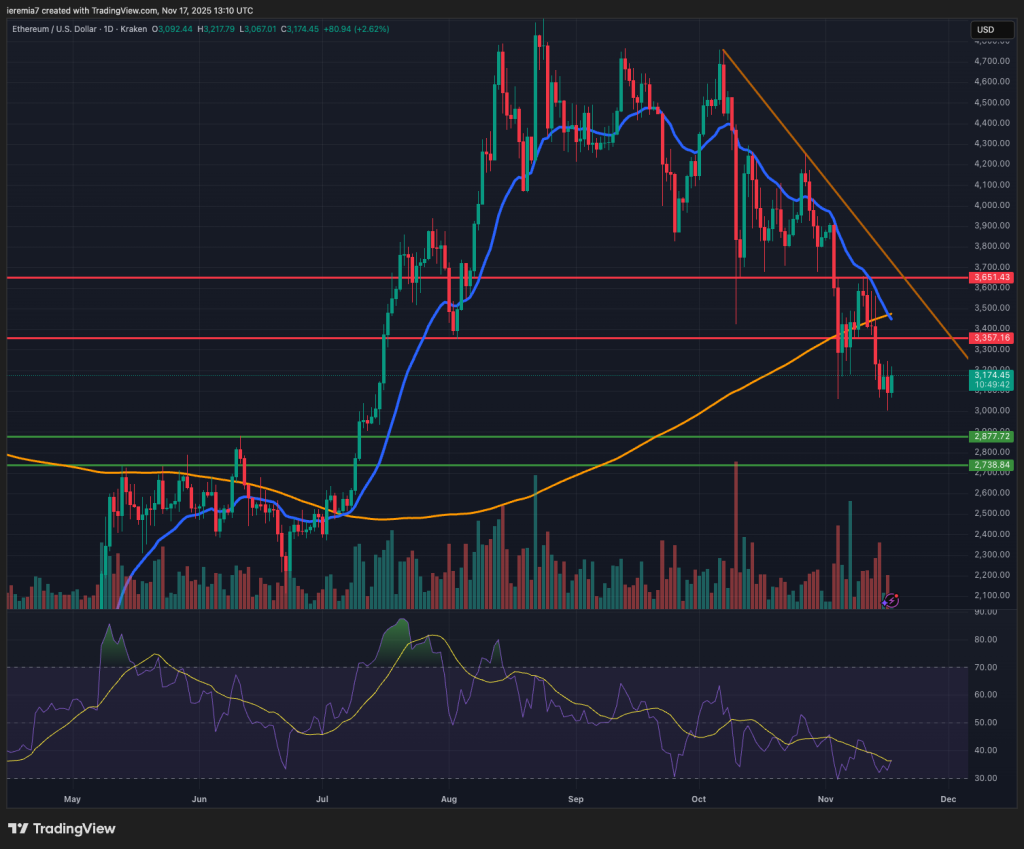
ETHUSD (Kraken)

Altcoins are facing a similar selling pressure and ETH failed to hold above the daily 200 SMA last week. A new lower low is a sign of weakness, even though we see mild buying at the time of writing.
We believe there’s scope for further selling into $2,870 – $2,750, a support area where stronger buyers could emerge. What’s happening right now is a great example of why traders shouldn’t count on seasonality alone.
November is usually one of the most bullish months for crypto and yet we are seeing strong selling across the board. ETH has to get back above the daily 200 SMA and break the bearish trend line to confirm a trend reversal.
Until that happens, the price is vulnerable in the face of “sell-the-rips” activity. The parabolic structure of the price action further reinforces the bearish stance.
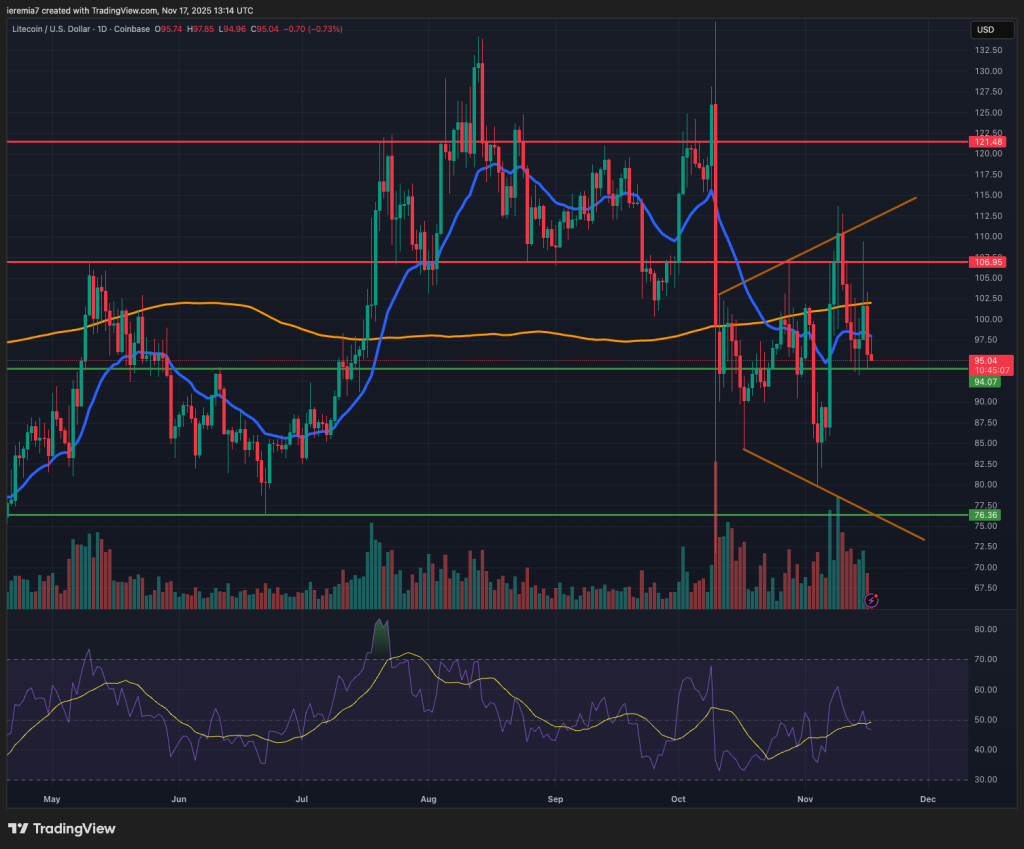
LTCUSD (Coinbase)

When it comes to Litecoin, the daily chart shows a price action structure called the megaphone. This usually signals an increase in volatility on both sides of the market and might be an environment for traders looking for short-term trades.
The upper side of the megaphone already acted as resistance and if the broad selling continues this week, we should see further weakness toward the $80 – $75 area. That should be the case if momentum fails to build.
In this case, the RSI is close to 50, so renewed selling could put pressure on the price. We see LTC as very vulnerable in the face of selling across the board and we favor the downside as long as current price action conditions persist.
Only a break back above $107 could revive some bullish sentiment, but at this stage, that seems like the less-likely scenario. Expect more volatility during the days ahead, as we get NVDA earnings, FOMC minutes and a series of US economic releases.


There are no comments at the moment, do you want to add one?
Write a comment