
BTCUSD (Coinbase)
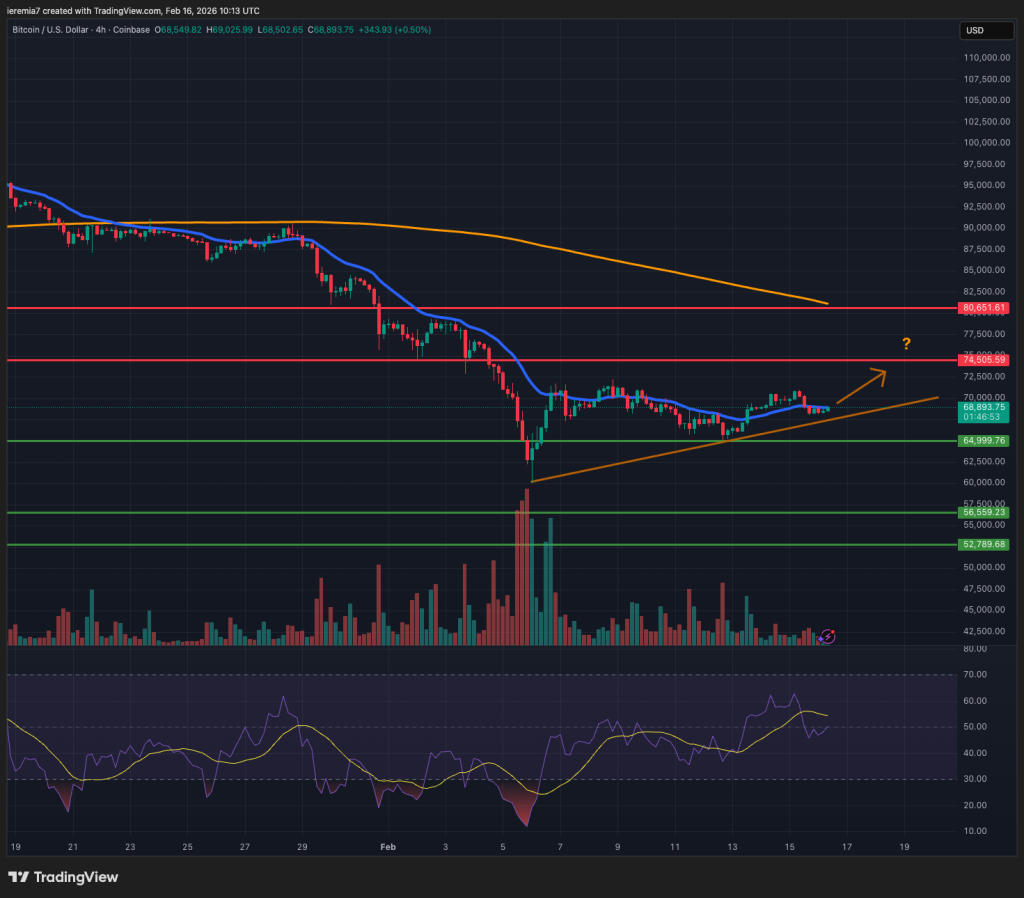
Bitcoin selling pressure eased last week and we are now seeing buyers attempting to form a bottom. On the 4h chart, the price has been hovering above and below the 20 EMA and despite this choppy price action, it suggests there is finally interest from the buy side.
You can also notice a short-term ascending trend line already confirmed by 2 points. If the market manages to stay above it, we see some upside potential into the $74,500 area. Breaking above $72,500 would be a sign of strength, which is why we expect more gains if buyers gather pace.
Below the trend line, support comes at $65,000. Traders should expect short breaks below key levels, followed by renewed buying pressure, since this happens often in a bottoming formation. We would turn bearish again if there is no bullish sign around the $65k area. In this scenario, we believe the February low might come under pressure.
Although we can’t say the bearish leg has ended and BTC can move higher aggressively from this point, it is possible to see a corrective move that may last for at least a couple of days.
ETHUSD (Kraken)
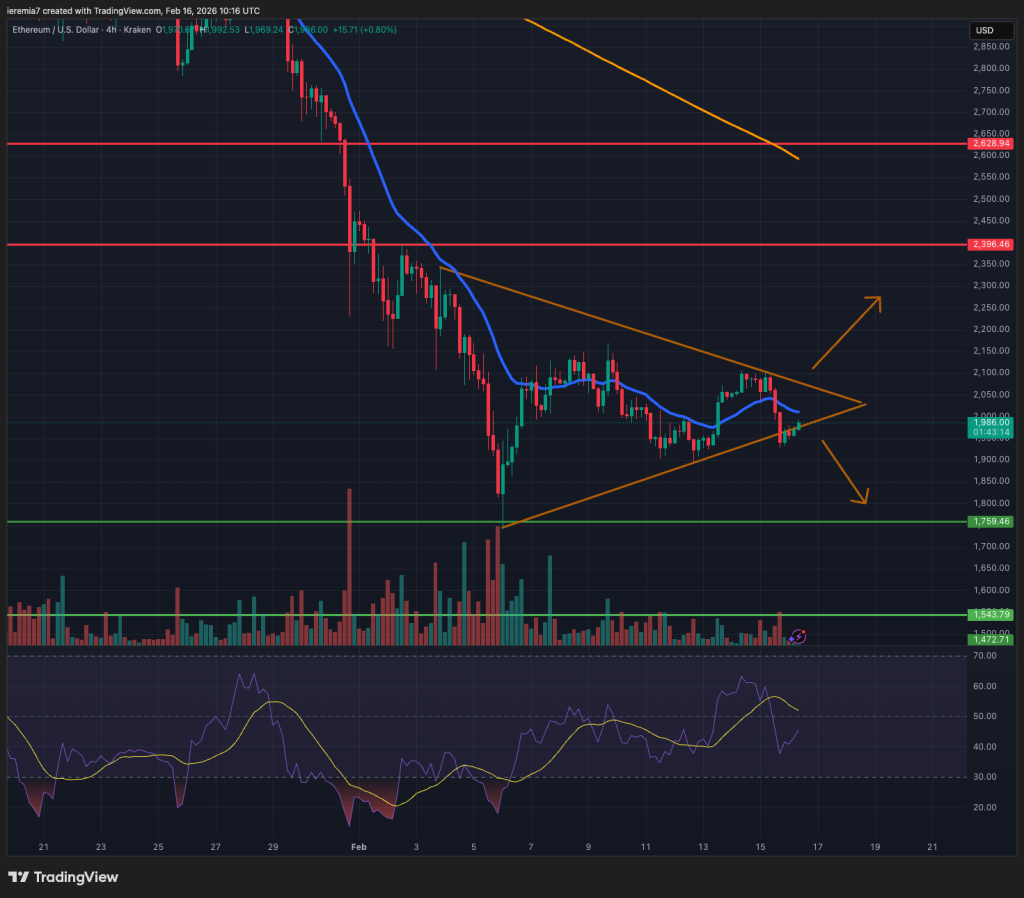
Ether has also been consolidating last week and we are currently seeing the price action locked inside a triangle pattern. With that being the case, the breakout might determine the next order of business.
More gains could follow on a break above and we think the price could recover towards $2,400 if buyers break and hold above $2,150. After a 50% drawdown in ETH, some long-term investors seem to be finding value, but there needs to be interest from short-term players as well to generate an impulsive leg up.
Below the triangle and below $1,900, sentiment turns bearish again. We could see the price retracing closer to $1,750 beforing finding strong bids again. It’s a holiday in the US today, meaning liquidity is thin across the board and traders should expect more activity starting tomorrow.
ADAUSD (Binance)
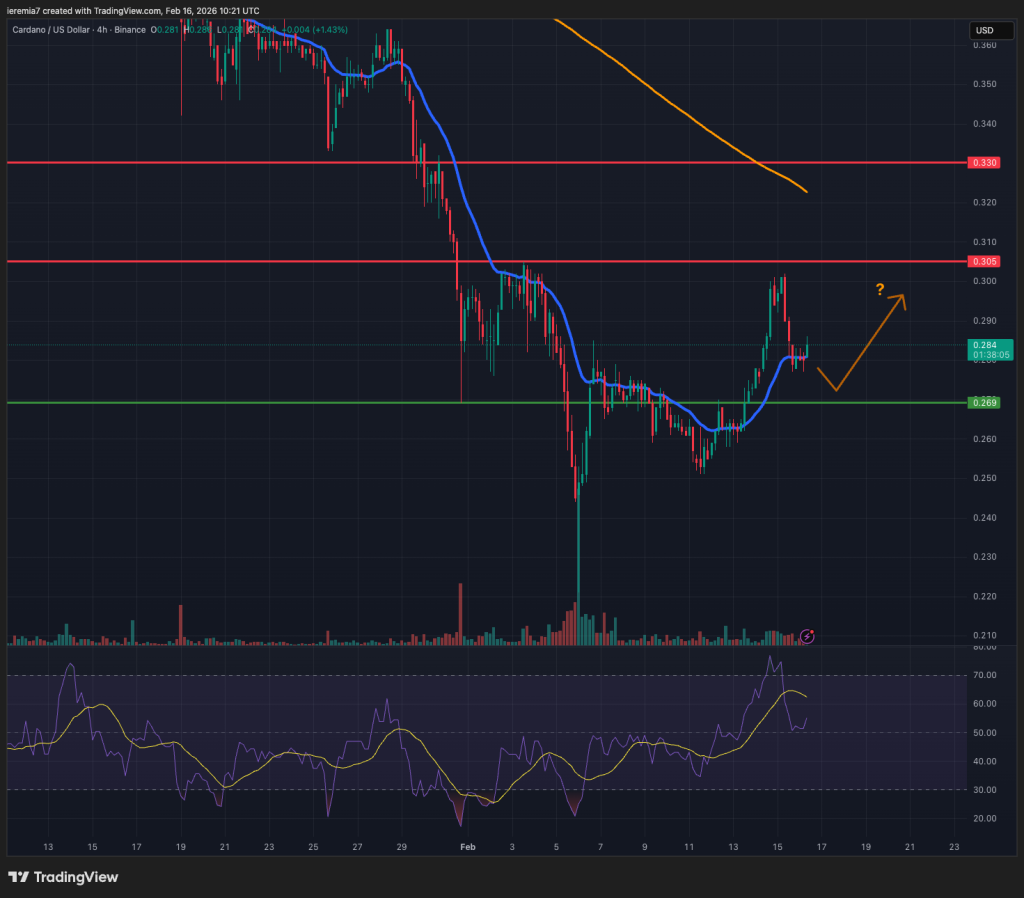
Cardano is posting better returns, since it is up 28% from its February lows. The price managed to break above the 20 EMA on the 4-hour chart and seems to bank on these developments. At the time of writing, we see consolidation around the EMA and that could suggest a new leg up into the 30 cents resistance area might be next.
We are short-term bullish on ADA as long as buyers manage to defend the 27 cents key support area. Below it, sentiment turns slightly bearish and could further slump if sellers drive the market lower impulsively.
Traders who want to buy dips should look at 25 cents and 24 cents for support. Based on current conditions, though, we favor the upside for the upcoming days and that scenario would be further reinforced if the broad market sentiment improves. Above 30 cents, attention will shift to the 4h chart 200 SMA, another important dynamic resistance level.


There are no comments at the moment, do you want to add one?
Write a comment