
BTCUSD (Coinbase)
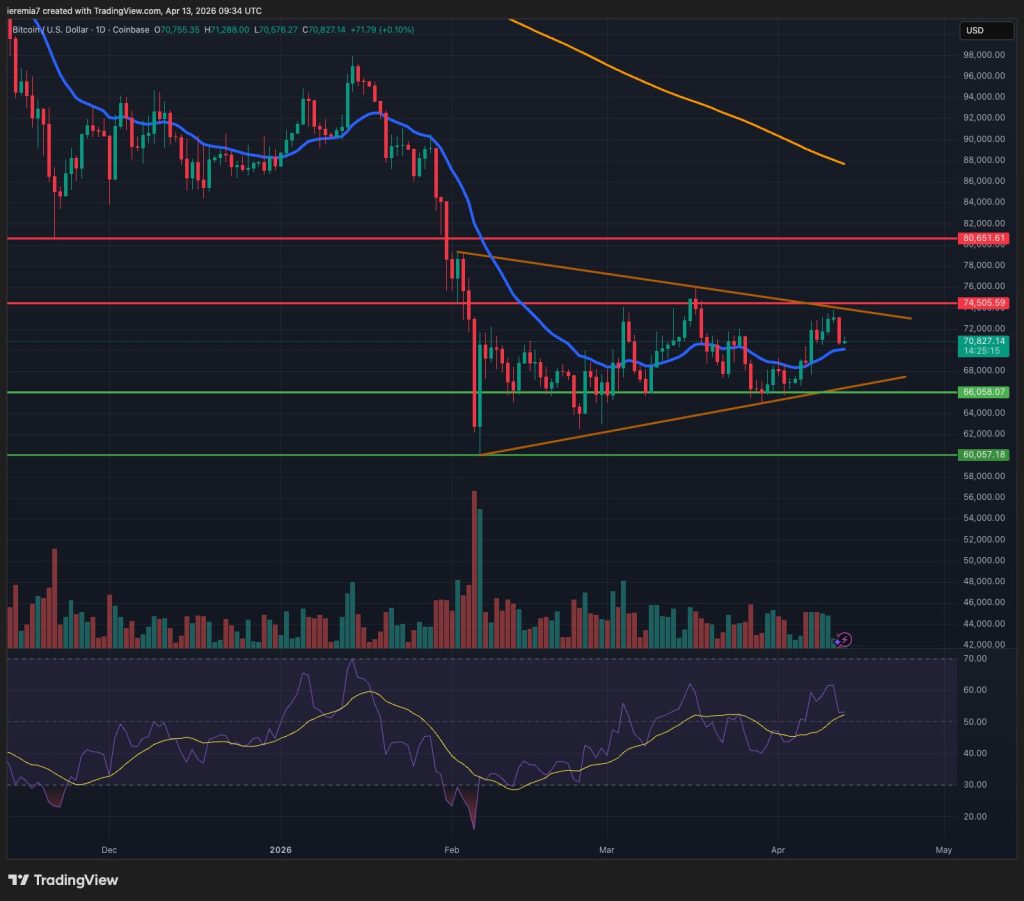
Bitcoin rose last week, came close to the upper side of our triangle channel and then started to weaken as talks between the US and Iran ended without a deal. Since the price trades inside the triangle, we haven’t yet shifted to a bearish stance.
We have to see if the selloff continues below the daily 20 EMA and the $66k area will also fail to provide support. Those two conditions must be met to consider that a new leg down might be developing.
Next support below $66k comes at $60k, where the market bottomed in February. No interest in buying there means more selling could push BTC towards $55k. Headline risk is still the main issue for traders, as just one important piece of news could completely shift sentiment.
Our bullish scenario involves a break above $74.5k, an important resistance level, and if that’s the case, buyers could then shift attention to $80.5k. Technically, since we are trading inside a triangle consolidation, both scenarios are valid for the week. Let’s see if risk aversion returns or the market looks past the recent geopolitical events.
ETHUSD (Kraken)
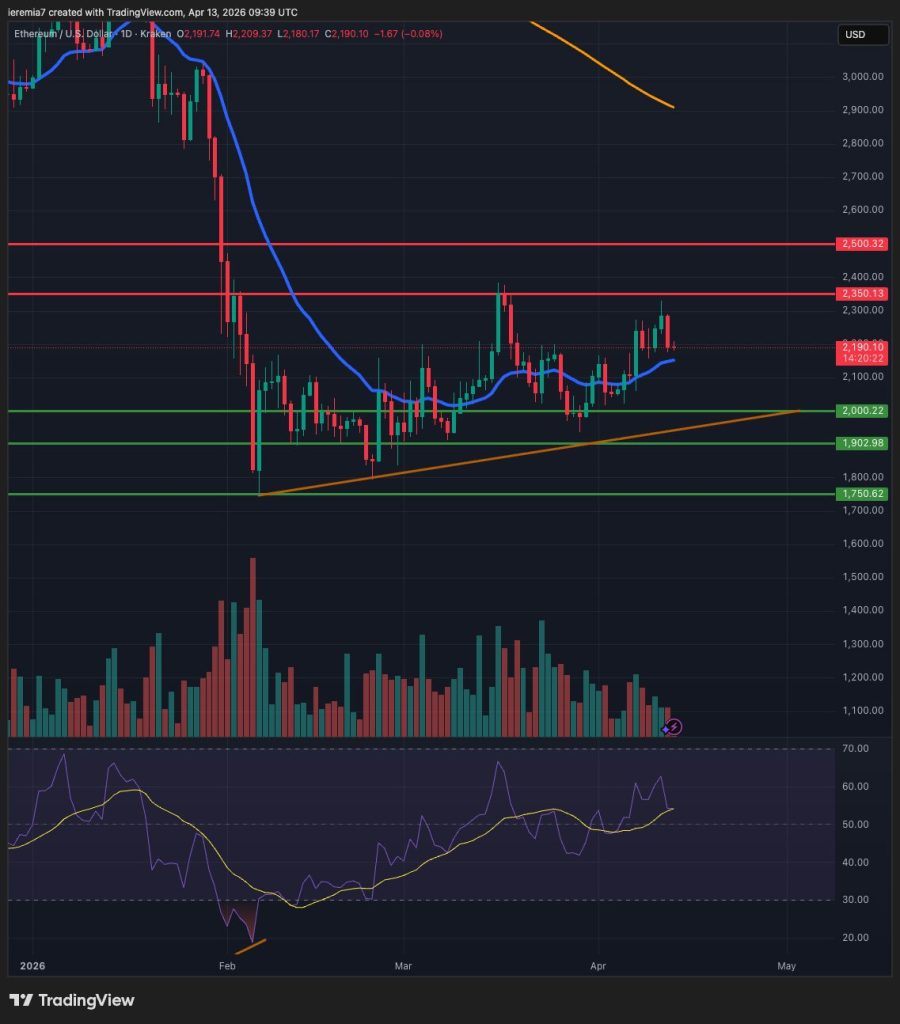
We are noticing a consolidative stance in ETH as well, since the price failed to reach or break the $2,350 key resistance line. This is a slight sign of weakness, suggesting sellers entered the market before the price reached the resistance.
The next step is to see whether the daily 20 EMA acts as support. If it doesn’t, attention will shift to the $2,000 area. Combined with a short-term ascending trend line, that’s a cluster of support levels that might generate impulsive buying.
As with Bitcoin, the appetite for risk influenced by geopolitics should be the main driver of order flow moving forward. Easing of risks could see the price breaking above $2,350 and reaching the $2,500 key level. Overall, the price action on the daily chart suggests indecision, which should continue until the conflict in the Middle East is settled.
LTCUSD (Coinbase)
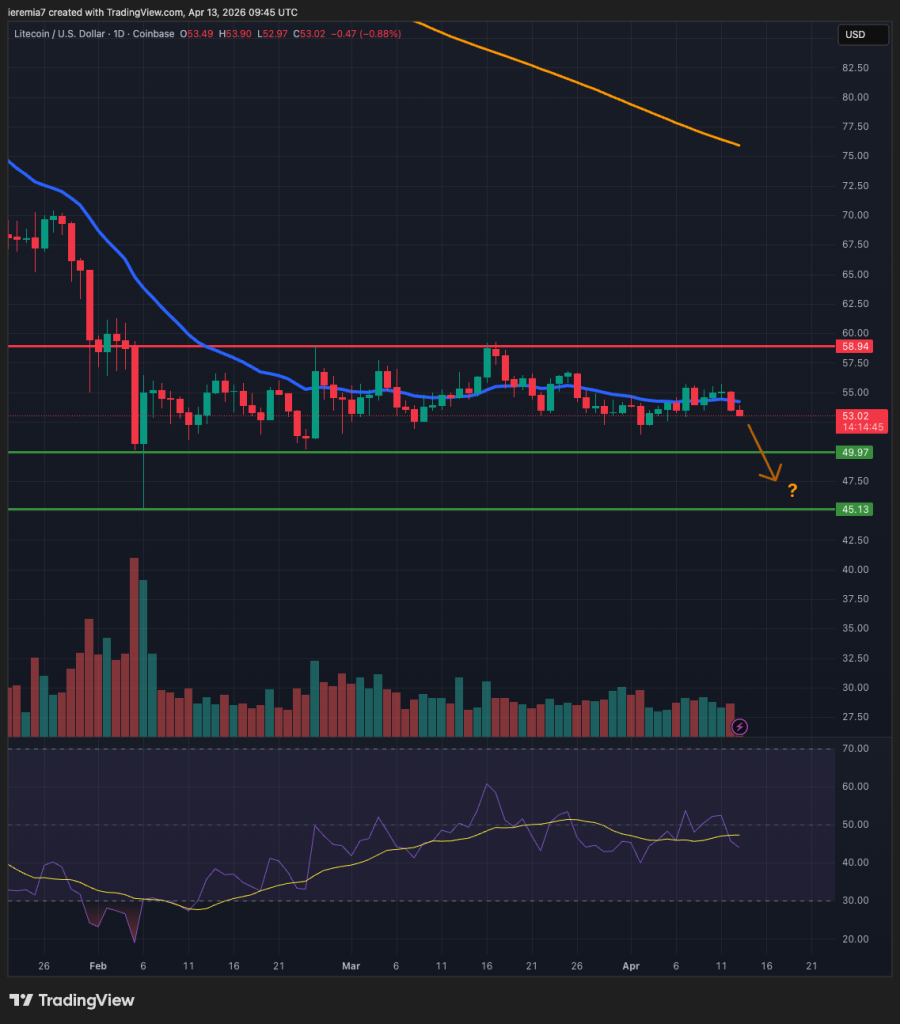
Litecoin’s price action is a classic example of impulsive followed by a corrective move. Since the beginning of February, the price has been consolidating between $45 and $59, suggesting weak buying activity. At the time of writing, the price is starting to show signs of weakness, since it has treated the daily 20 EMA as resistance again.
Should selling continue, the next downside target comes at $50. It’s a key psychological area and a place where passive buyers are likely to place their bids. Below that, the February low around $45 would draw most attention. There is no sign of bottoming for now and there should be impulsive buying in case the Feb lows are retested.
On the upside, clearing $56 is the first move that would suggest sentiment is improving. Should that happen, pressure will mount on $59 again. That’s what buyers need to see if they wish the price to edge up towards the daily 200 SMA.


There are no comments at the moment, do you want to add one?
Write a comment