
BTCUSD (Coinbase)
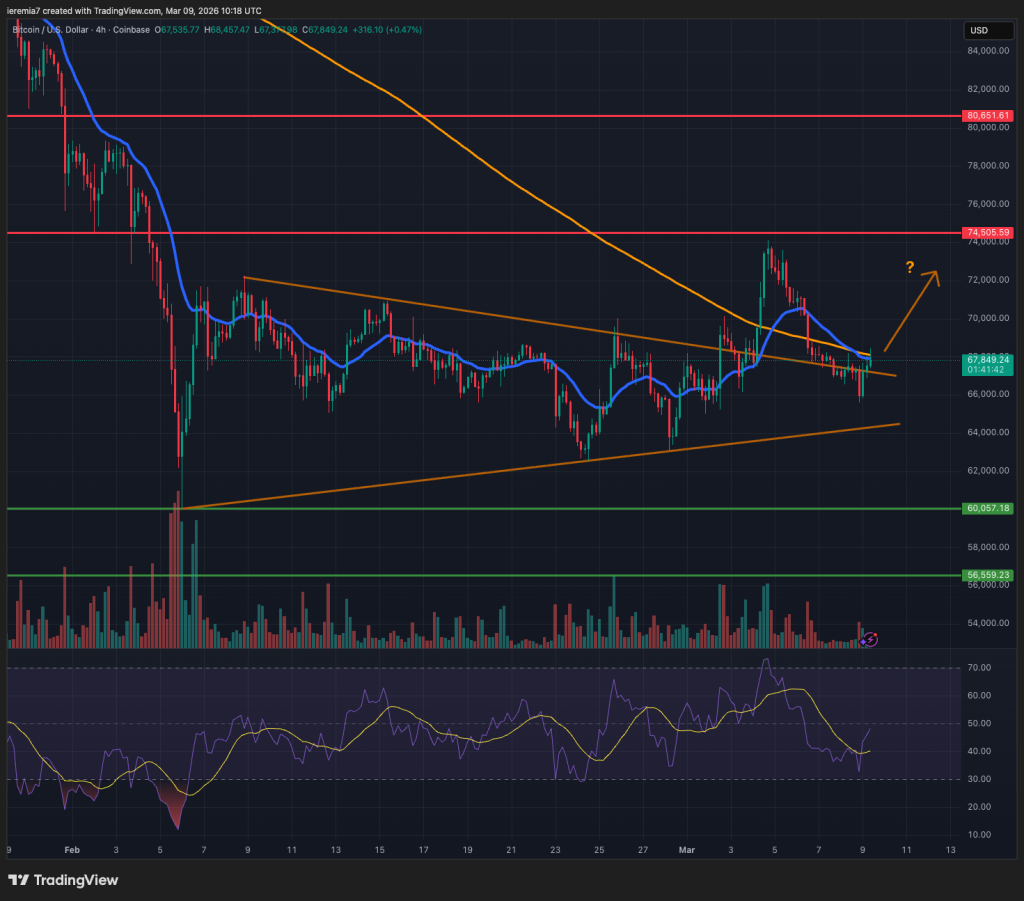
Despite choppy activity, Bitcoin remained steady last. That came even though tensions in the Middle East have not eased yet. Signs of stabilization despite geopolitical risks might reinforce the fact that this is truly a bottoming formation.
Simply put, buyers are willing to step in and prevent further downside. The price has breached above the triangle consolidation we mentioned a week ago and came very close to our resistance level at $74,500.
Since then, the market retraced back to the broken structure and at the time of writing, we’re seeing some early signs of buying activity. In case the price continues to move up, expect pressure to mount on that $75k area again.
Failure to do so would mean more downside. We need to see BTC breaking below the $64k area first. If sellers drive the price below that zone, we think $60k might be the next potential target. The path ahead depends on geopolitics, unfortunately and you should expect the price action to be heavily driven by news related to the Middle East. Because of that, it’s hard for us to determine where BTC might head next.
ETHUSD (Kraken)
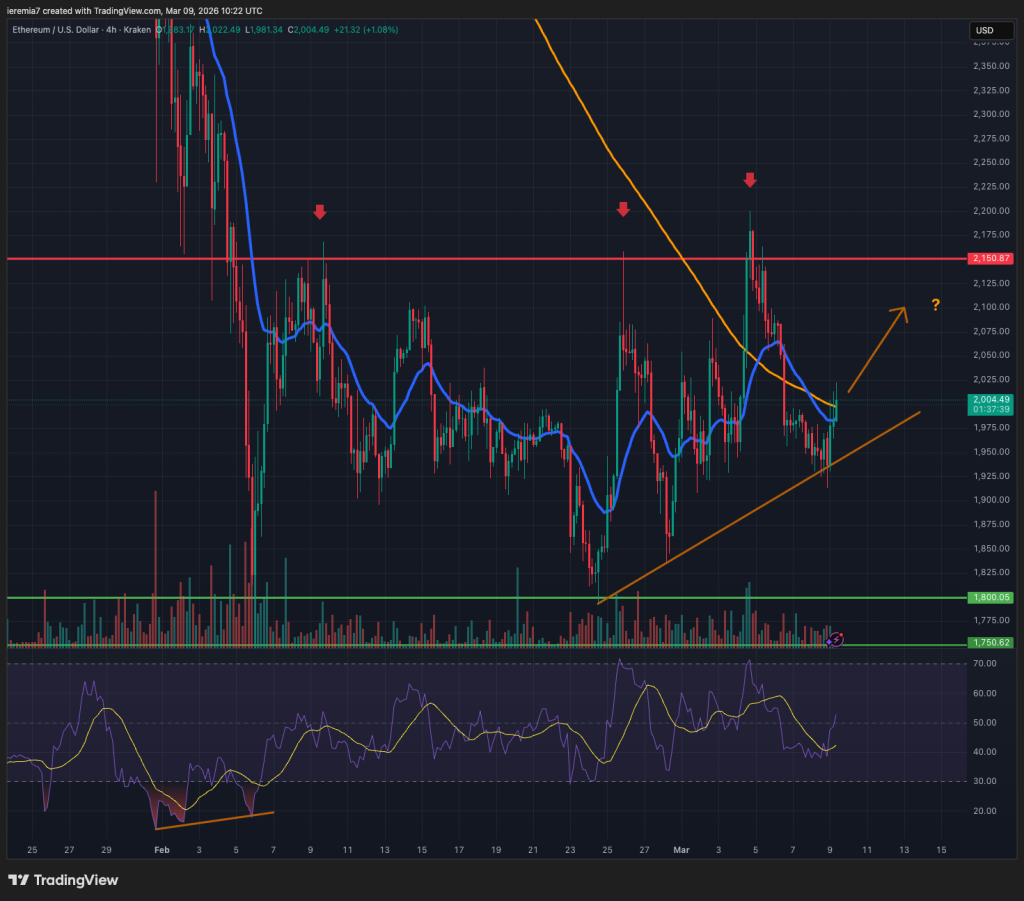
Ether had a similar performance to Bitcoin: edged higher into the $2,150 resistance and retraced most of those gains. Interestingly, as you can see from the chart, the push higher managed to exceed some prior highs, suggesting buyers might actually start to gain control over the order flow.
Additionally, a short-term ascending trend line has emerged and as long as it holds, we think the market can continue to recover during this week. In this scenario, we expect ETH to edge towards $2,150 again. The market is ranging until a break and hold above will materialize.
Below the trend line, we’ll turn bearish and expect the move to extend closer to the $1,800 support. As things stand right now, this looks like the least likely scenario, but yet again, the mood could be influenced by politics at any point.
LTCUSD (Coinbase)
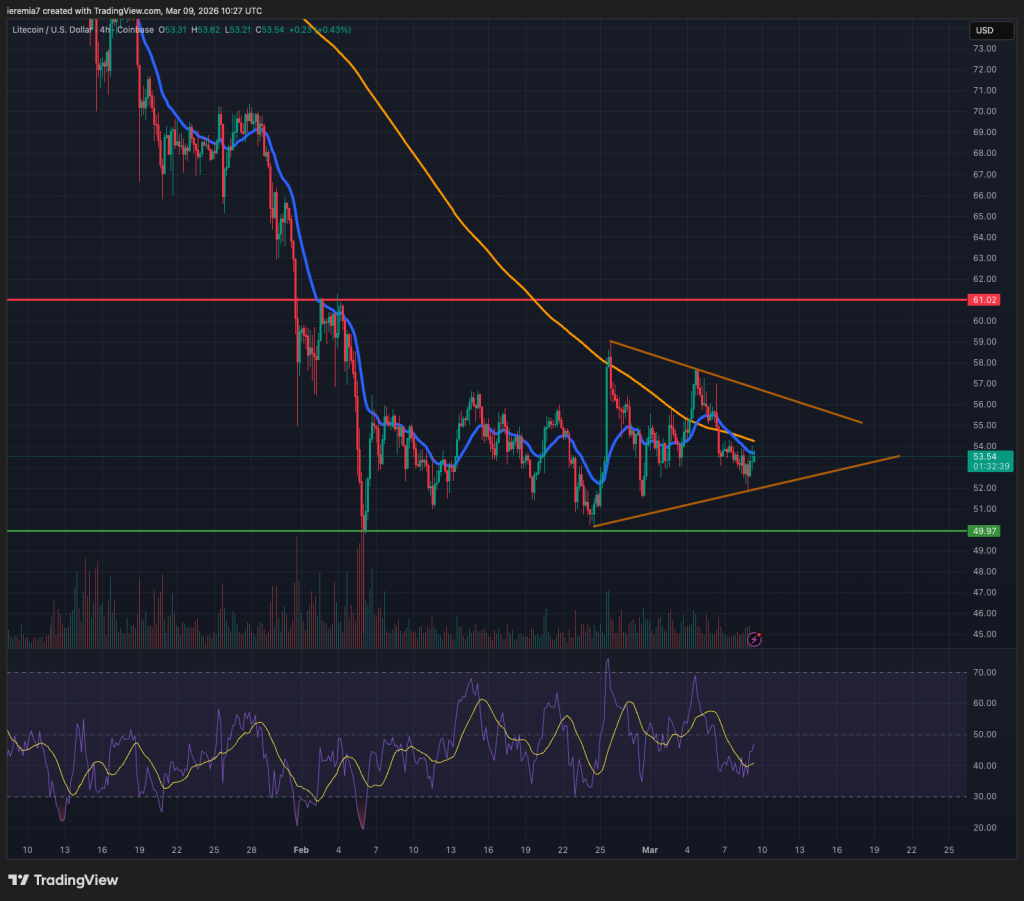
Litecoin is also consolidating in a triangle after an impulsive move lower and this comes in line with the broad market’s lack of direction. We think dips towards the lower end of the triangle are buying opportunities, as long as the structure remains in play.
Breaking above the 20 EMA and 200 SMA on the 4h chart will be a positive development and in that case, we expect the move up to extend towards the $56 area. Breaking above the triangle would open more room towards $61, another important resistance level.
The bear case involves a break below the triangle, followed by sustained selling. In that scenario, we would like to see whether the $50 key psychological area caps the downside. If yes, then that could be a trap for sellers and the price could start moving up again. If the situation in the Middle East eases, the path of least resistance is up, given oversold conditions across most altcoins, not just LTC.


There are no comments at the moment, do you want to add one?
Write a comment