BTCUSD (Coinbase)

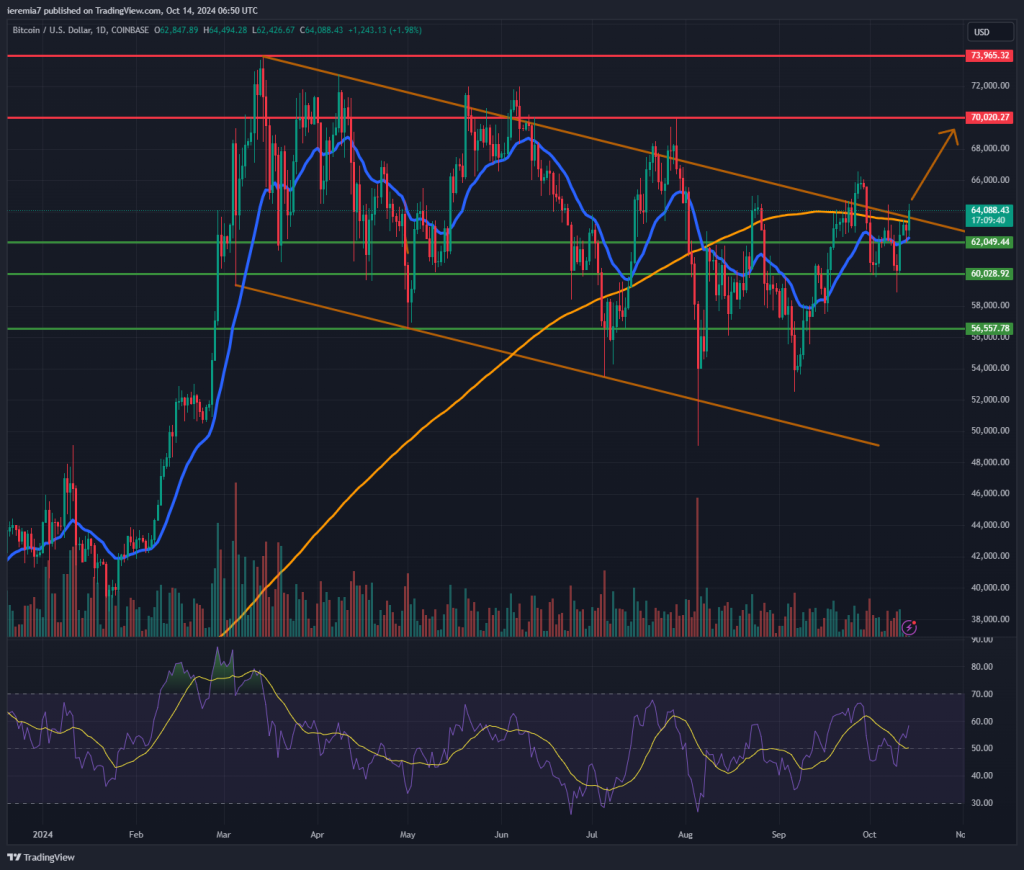
Bitcoin is testing the upper line of our consolidation channel again and for that matter, we believe the likelihood of a breakout and extension higher has increased. When the price is squeezed towards a key area, eventually a spark in volatility occurs.
Seasonality also helps the mood, so we believe this week might be the time when the breakout finally occurs. The first hurdle is $66,000, but if our assumption is right, then the next likely target is a new all-time high.
Of course, we can’t rule out $70k or the current ATH. You do have to consider that the market has been consolidating since mid-March, which is a relatively large period. When a breakout occurs, it usually leads to a burst in volatility. Bearing no major surprises around the US election or geopolitical tensions, we think BTC is poised to hit $100,000 before the year ends.
If we start to see renewed weakness, support is expected around $62k and the daily 20 EMA. Below that is the level we have mentioned so many times – $60,000, which is also where large volumes have been traded during this year.
ETHUSD (Kraken)

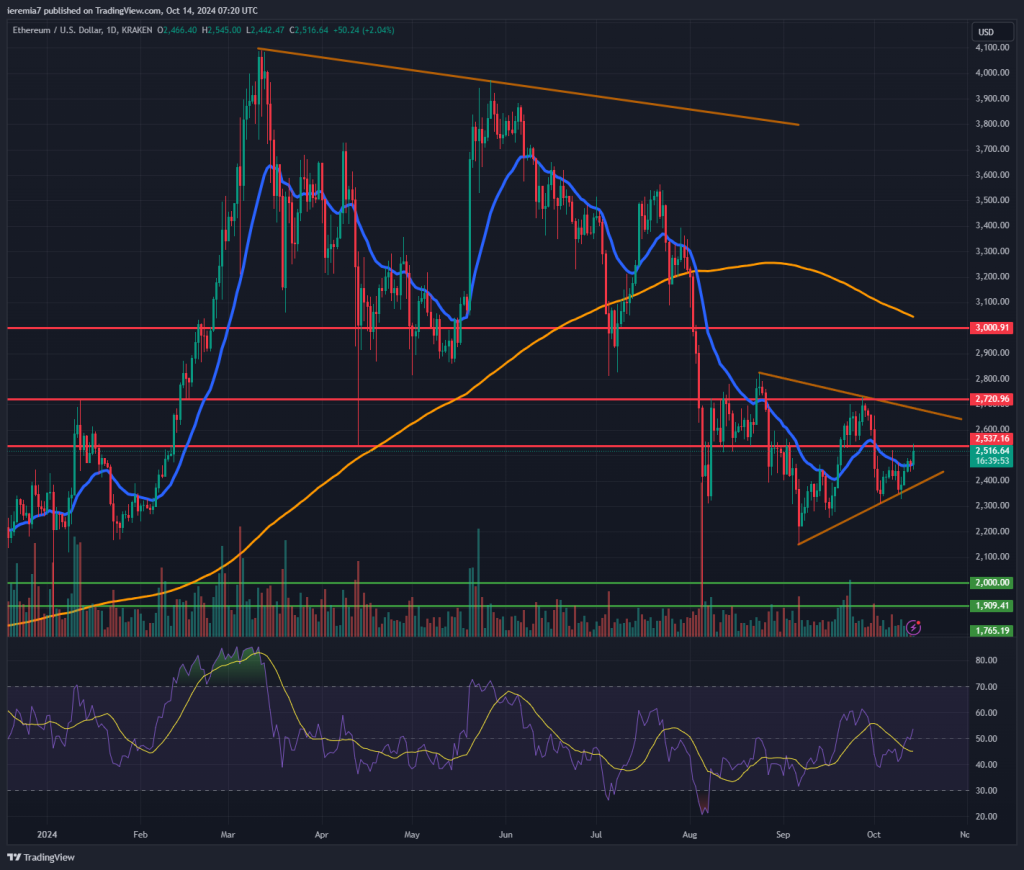
Although Ether trades well below all-time highs, the sentiment seems to be improving here as well. Despite a temporary dip, buyers are slowly gathering momentum, which could continue to build up in the coming days.
Right now, there seems to be some resistance around the $2.5k level. Once that’s cleared we’ll shift our attention to the upper line of the triangle + the $2.7k resistance. Breaking that area will have a major significance for buyers since it can unlock strong bullish momentum that could carry the price up to $3k.
We’ll shift to a bearish stance only if ETH breaks below $2.3k. At this moment, that doesn’t seem to be the case and we should see follow-through buying if Bitcoin keeps adding more gains. All options are on the table, but we prefer to err on the bullish side for now.
LINKUSD (Kraken)

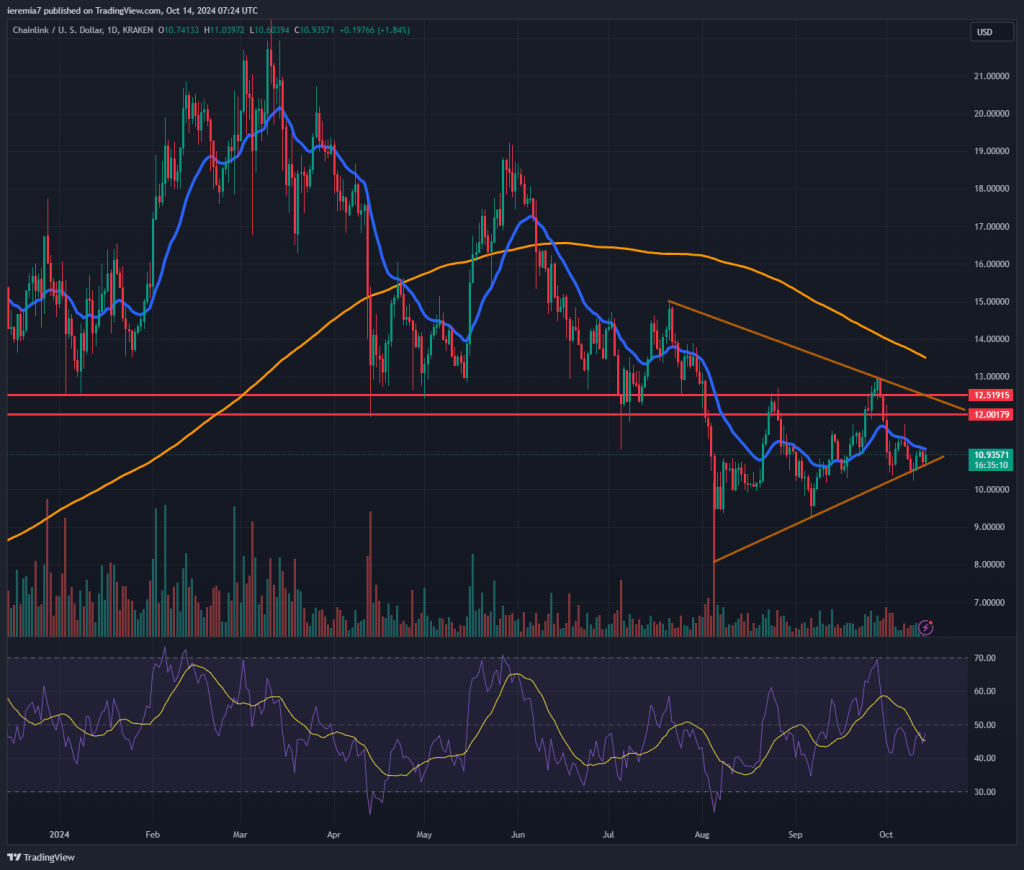
Even though Chainlink continues to be in a bearish trend, we are noticing the potential for a bullish bounce. The market has been consolidating since August and thus far, has respected the ascending trend line drawn on our chart.
At this stage, a bullish trade makes more sense from a risk management perspective. If the market does bounce, then the price could head towards the $12 – $12.5 key resistance area. We need to see a break below $10 to shift our view to bearish.
The string of higher lows and higher highs is favoring bulls and if we add the positive seasonality to the mix, that makes the case for a new leg up during the upcoming days and weeks. We could be wrong, which is why we are constantly monitoring the price action.
A dip below $10 will be our initial sign of weakness. LINK could then dip to $9 or $8, two other important support levels on the chart.


There are no comments at the moment, do you want to add one?
Write a comment