
BTCUSD (Coinbase)
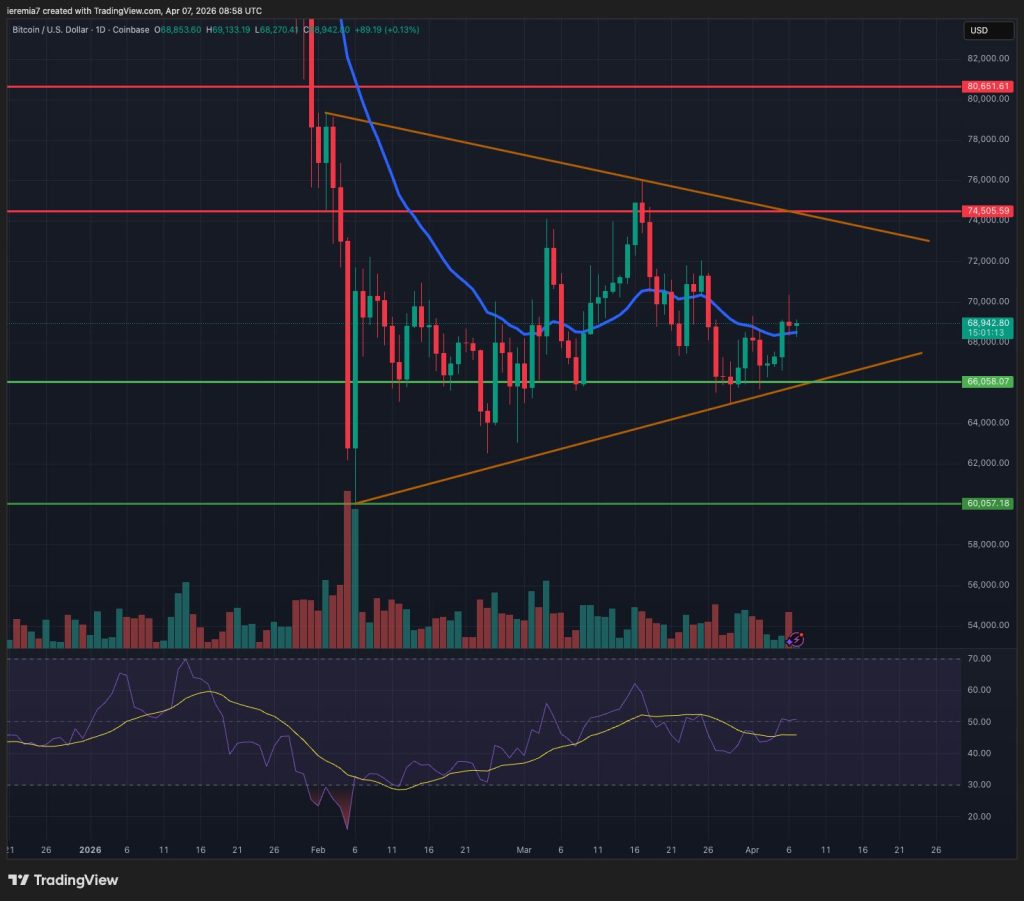
Bitcoin volatility has dropped during the last week, probably due to the Easter holiday. Although the Middle East conflict has not yet concluded, financial markets are starting to look past it. We say that because BTC didn’t make new lower lows.
That doesn’t mean we are out of the woods yet. As our chart shows, the price action is consolidating inside a symmetrical triangle pattern. As long as the structure is respected, traders should stick to range trading.
We see support around the $66k area and an impulsive break below $64k would open the door for $60k. Buyers seem willing to buy dips, so with that being the case, sellers should make sure they short the market on very bearish news.
To the upside, more gains would push BTC towards the $73k – $74k resistance area. That’s a critical zone to overcome should we want to see more gains down the road. The market is anticipating easing of tensions so if that materializes, expect a rally in BTC that could last for a couple of weeks.
ETHUSD (Kraken)
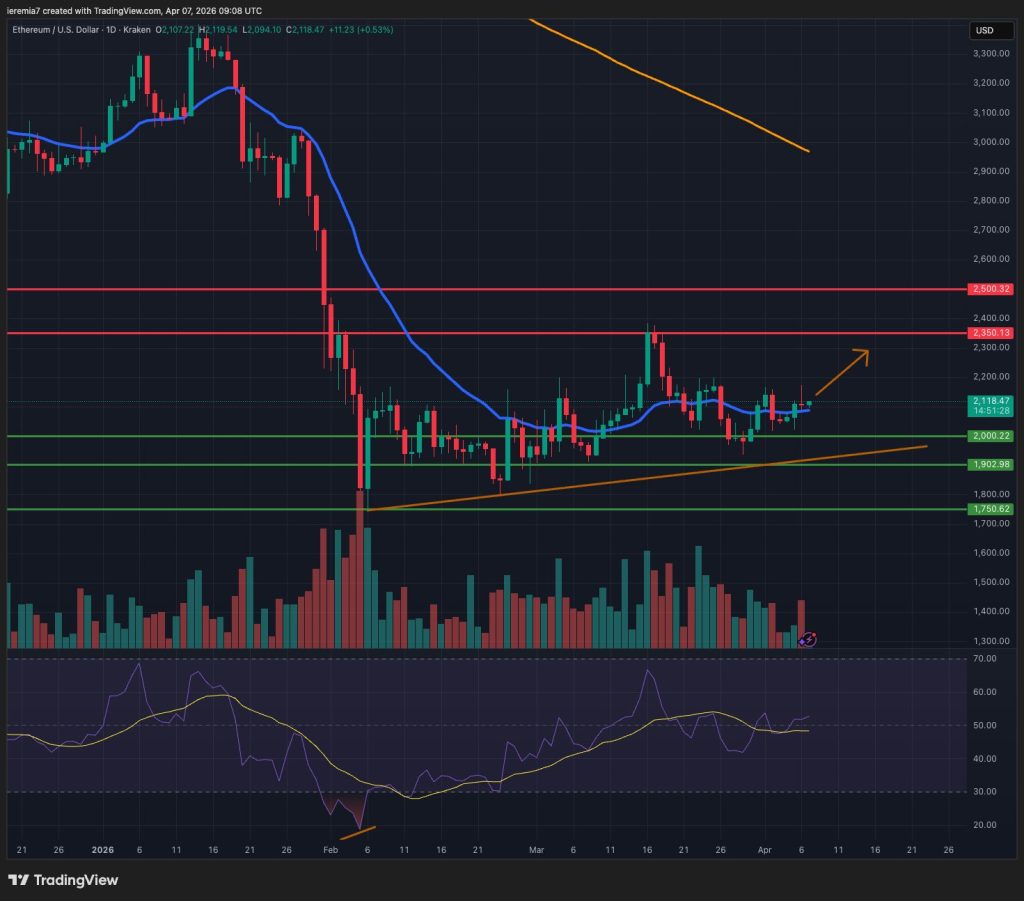
A slow grind higher can be spotted on the Ether daily chart as well, suggesting an accumulation might happen behind the chart. Things seem to look better when compared to Bitcoin, simply because the price action is posting clear higher highs.
The next important step is to continue higher and break above $2,350. That’s a resistance area we’ve flagged in the past and it managed to cap the upside in March. Above it, we see supply at $2,500.
However, a surge above March highs would imply an easing of tensions in the Middle East, so in that scenario expect a lot more upside. We are short-term bullish as long as the ETH price trades above $2,000 – $1,900. Below that zone, things could get tricky as sellers might be incentivized.
The bullish trend line on our chart must hold in order to keep the upside scenario intact. That’s the most likely outcome as things stand right now, but don’t forget a single Truth post can rattle the markets.
TRXUSD (Bitfinex)
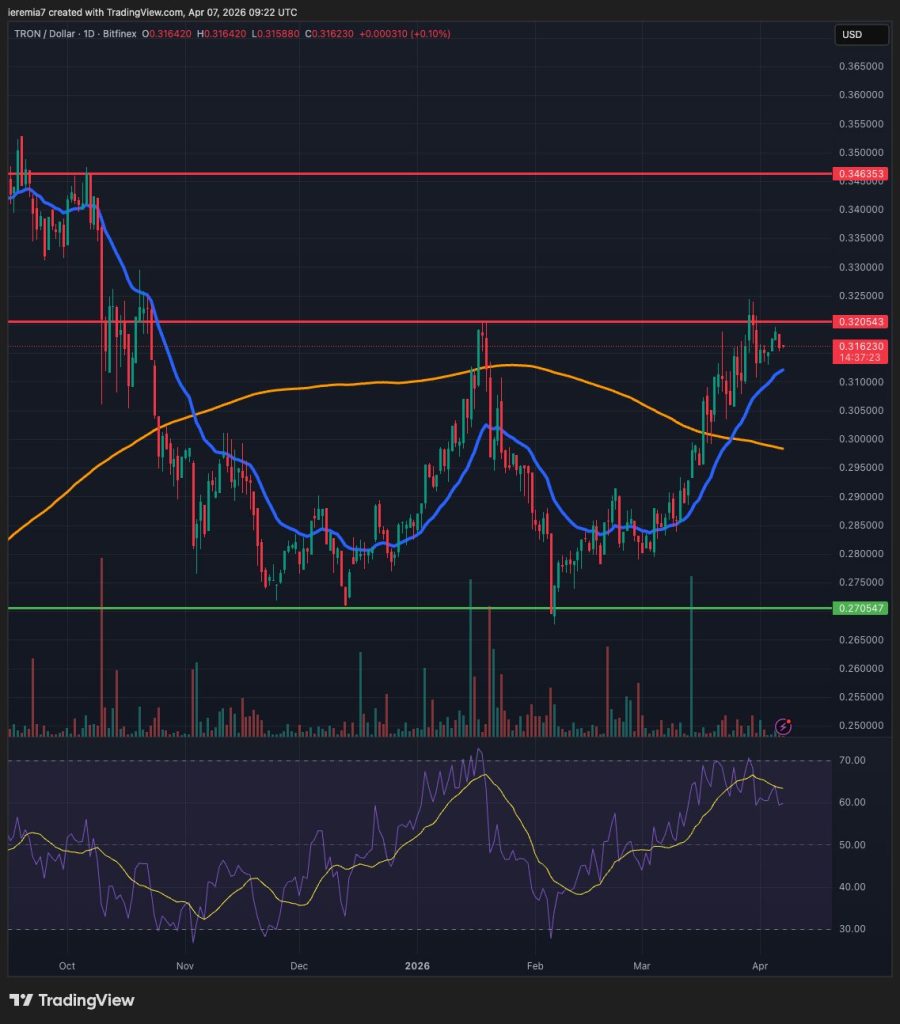
Despite tensions across all markets, some cryptocurrencies managed to outperform. One of them is Tron and we can see from the chart that the price is close to the 2026 highs. The 32 cents area acted as resistance in March, so as long as the price stays below it, we could see some short-term weakness.
Breaking below the daily 20 EMA would signal stronger selling pressure, but we won’t shift to a bearish stance until the price trades below the 200 SMA at 30 cents. For the time being, TRX is locked in a range between 32 cents and 27 cents.
A break on either side has the potential to unlock a wider move. Above 32 cents, we see upside potential into 35 cents. This is a cheap coin and even small traders can get involved without having to commit a lot of capital.


There are no comments at the moment, do you want to add one?
Write a comment