
BTCUSD (Coinbase)
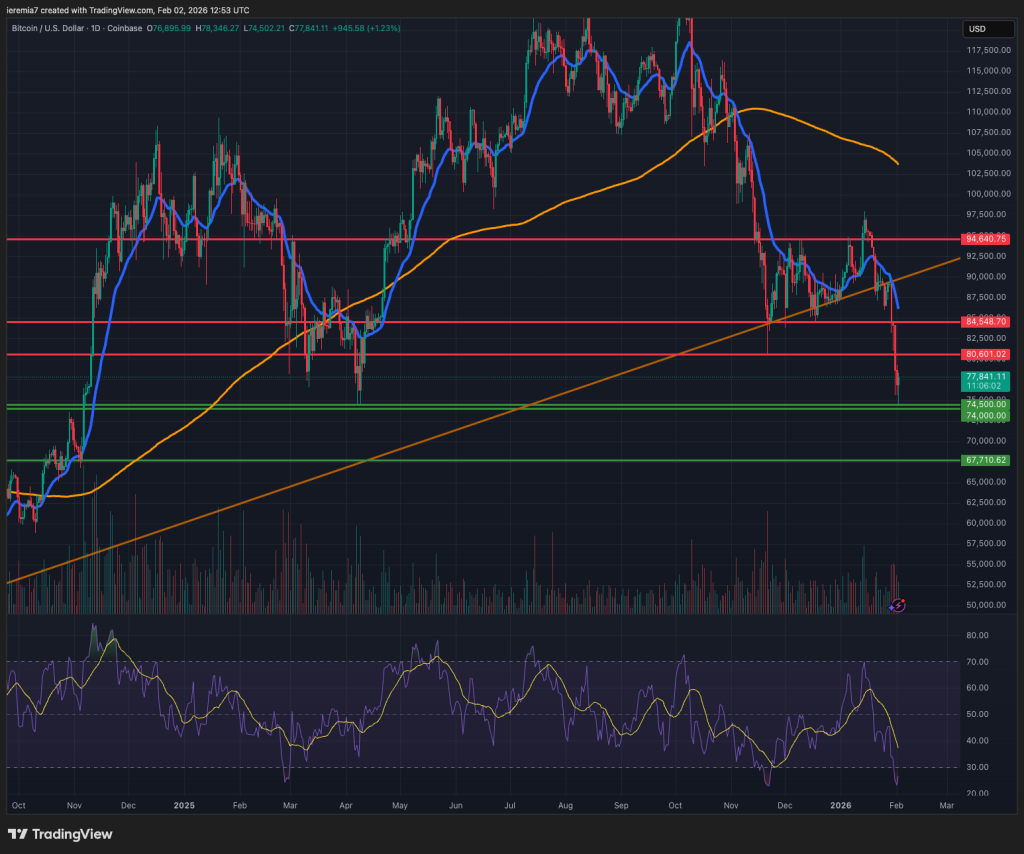
Bitcoin continued to slide lower last week and the impulsive drop we’ve witnessed in precious metals only added fuel to the fire. We have broken the bullish trend line and for that matter, the overall picture is not favorable to sellers, even though we might see a pullback from oversold levels in the short term.
The $74,500 – $74,000 area is a key support and we’ve already seen buying interest there. If current weekly lows hold, then the price could recover towards the $80.600 area. Also, we see resistance at $84,500 as well. The price has to break above the daily 20 EMA and back above the broken trend line to suggest the bullish sentiment returned.
That’s unlikely at this point and such a sluggish start of the year is usually a sign of more selling down the road. Another theory to consider is that we are in a large head and shoulders pattern and from this point forward, the right shoulder will start to unfold. Short-term, that’s bullish for BTC, but in the longer run, it could mean heavy selling.
ETHUSD (Kraken)
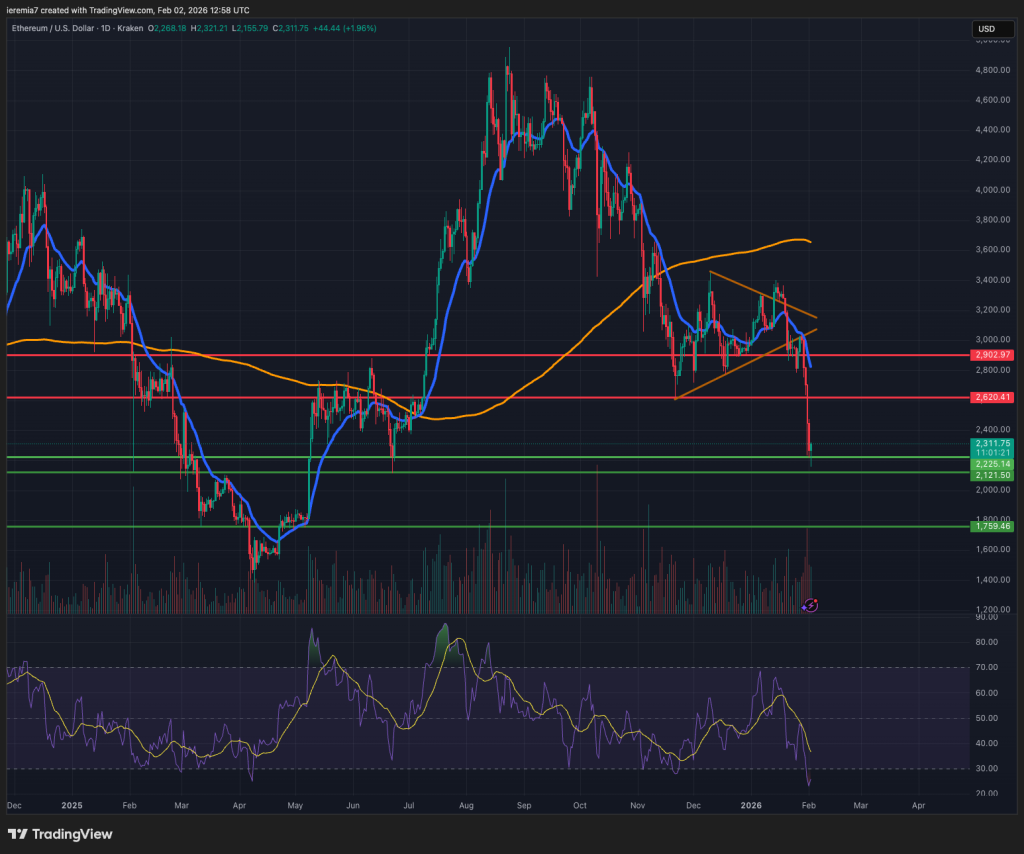
In line with last week’s projections, Ether continued to weaken and reached all our support levels. Right now, there is some mild buying, but that’s normal given the oversold conditions on the daily RSI.
Also, the price is far from the daily 20 EMA and this could be the right time for a corrective move higher. We aren’t trying to imply a trend reversal is about to happen, though. We see ETH vulnerable to further selling if the price manages to get closer to the $2,650 resistance area.
On the downside, further selling below $2,100 would mean the price has room to go until $1,750. For now, there is no catalyst that can turn the tide in the crypto space. Other than a short-term technical bounce, it’s hard to imagine something better.
ADAUSD (Binance)
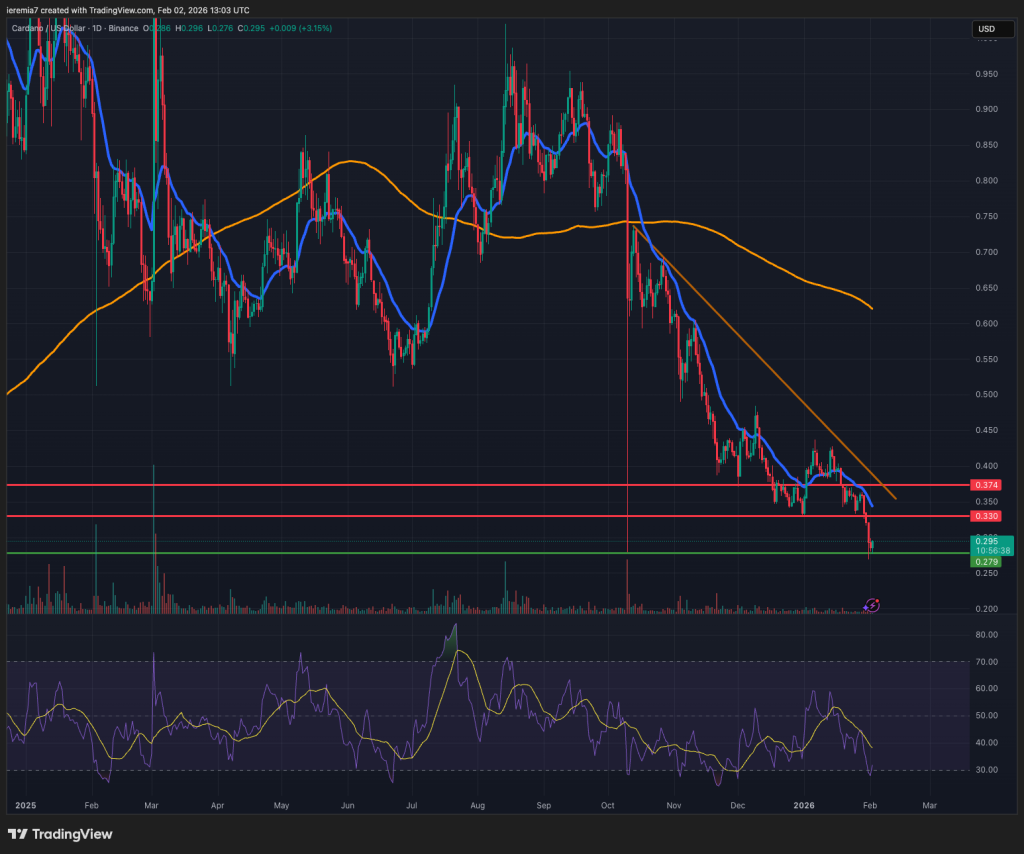
Several weeks ago, we touched on Cardano and said that, given the technical picture, the price could ease further towards the October lows. That has actually happened and we are now seeing early signs of selling exhaustion.
In case the broad market sentiment continues to improve, ADA should be able to retest the 33 cents resistance area. Don’t forget the price is still below the daily 20 EMA and below a bearish trend line.
Our view will shift to bullish only if buyers are able to break and hold above both. Anything less than that suggests sellers are still in control and ADA is vulnerable to selling on rips. Breaking and holding below 28 cents could mean the next area of interest will shift lower to 20 cents.
In any case, we favor a short-term correction higher, but for now, we are not sure if that move has legs to go up. Traders should watch for price action clues on lower time frames when the price hits any of the resistance levels we’ve mentioned.


There are no comments at the moment, do you want to add one?
Write a comment