
BTCUSD (Coinbase)
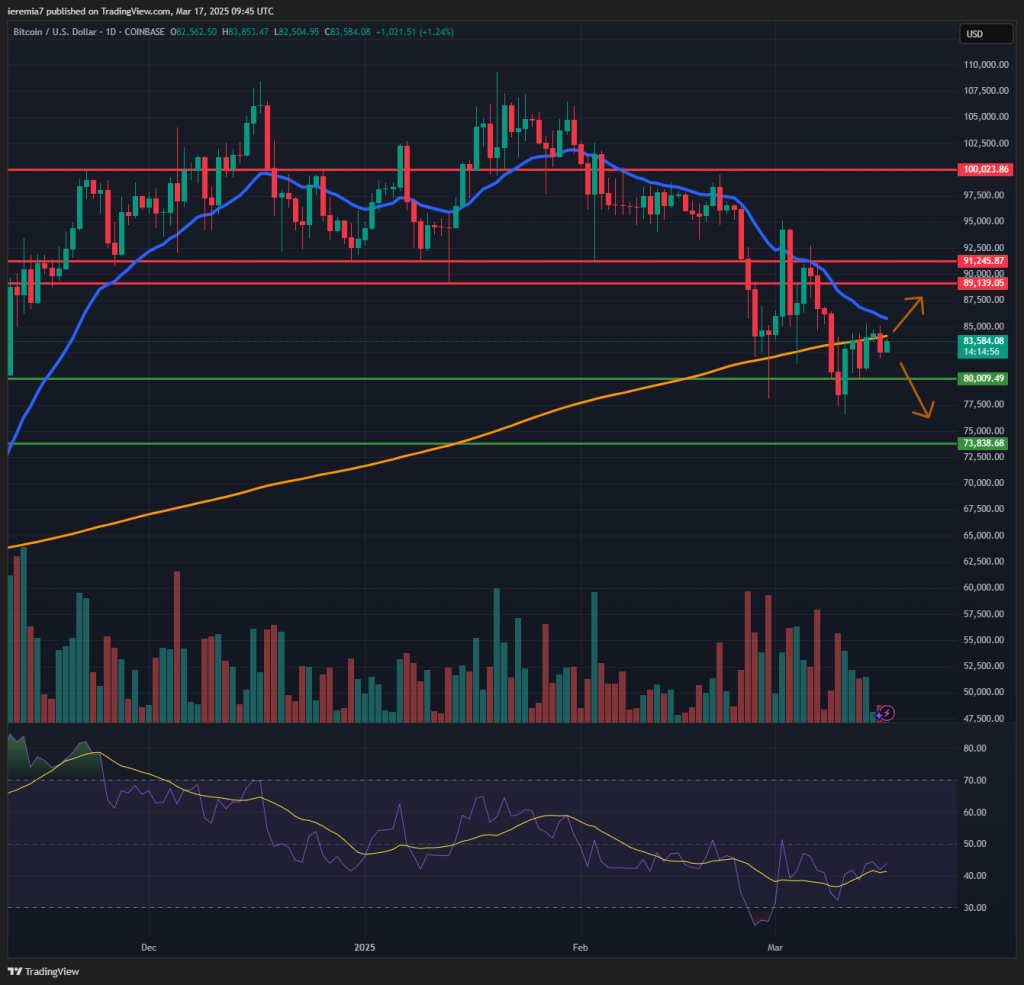
Bitcoin didn’t continue lower last week; in fact, it closed on Sunday with mild weekly gains. Still, it continues to trade well below the ATH, which is not encouraging bulls to step in aggressively.
The daily 200 SMA seems to act as resistance, but buyers are entering on short-term dips, suggesting a leg up might extend during the upcoming days. We have a new FOMC meeting on Wednesday and this event is known for its potential to spark volatility.
Also, BTC traders should watch how major tech stocks perform, due to their positive correlation with crypto. If the price breaks and holds above the 200 SMA, we think there could be scope for a push up into the $89k – $91k key resistance area. An impulsive move above that zone will be a clear signal of bullish strength and $100k will become the natural target.
Renewed selling below the 200 SMA will put $80k under pressure. We continue to see $73.8k as a key role reversal level and support. As a prior ATH, the market tends to revisit such areas and this time might not be different.
ETHUSD (Kraken)
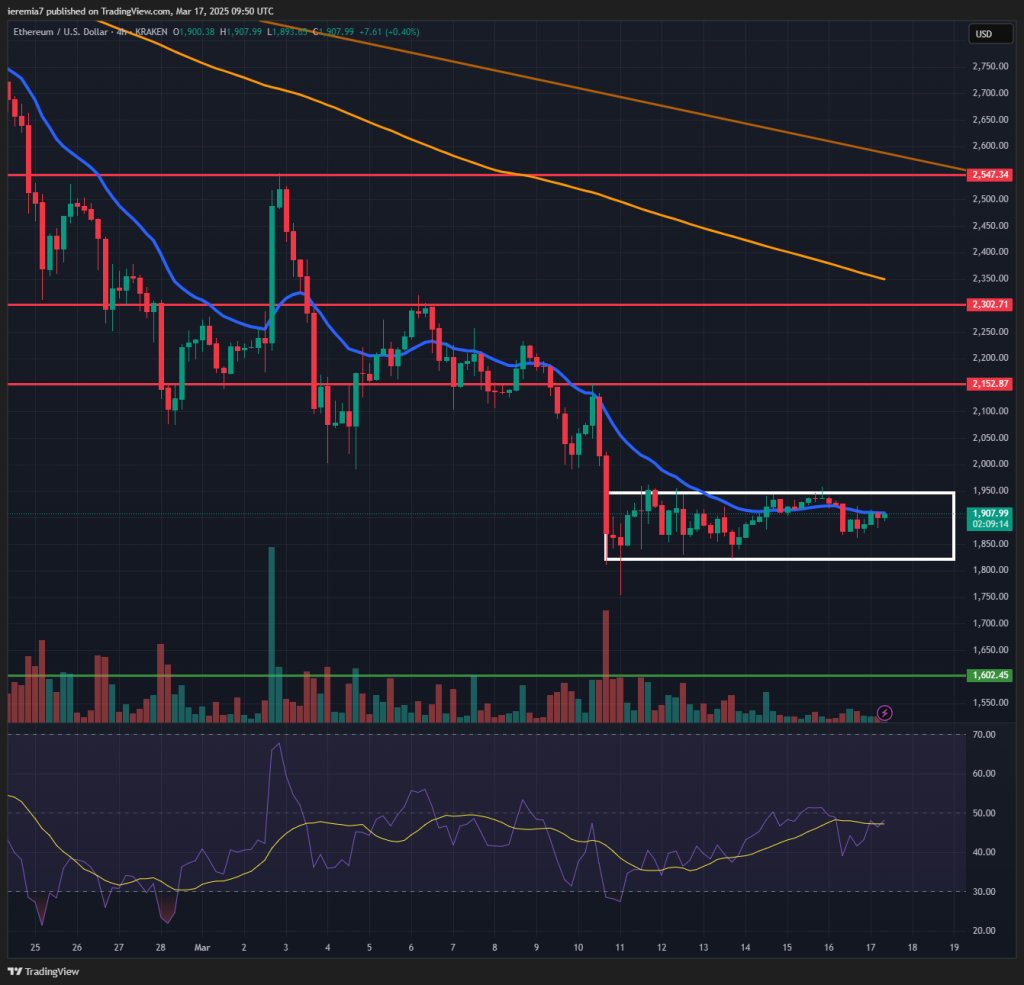
Looking at ETH, the price action context is not so bright, for now. We see a narrow consolidation in between $1,950 and $1,820, suggesting low volumes and a lack of interest from both sides of the market.
Since the correction happens after a bearish impulsive move, one might say it’s just another continuation signal. Still, we want to see Ether breaking below the lower bound of the range before considering an extension down to $1,600. That’s a key support we have mentioned in the past and given the sluggish bullish interest, we could see further weakness ahead.
Breaking the range to the upside will be a bullish signal and in that scenario, we think Ether might continue to recover into $2,150 and $2,300. Don’t forget the price is still well below a bearish trend, which leaves ETH vulnerable to “sell-the-rips” scenarios.
LINKUSD (Kraken)
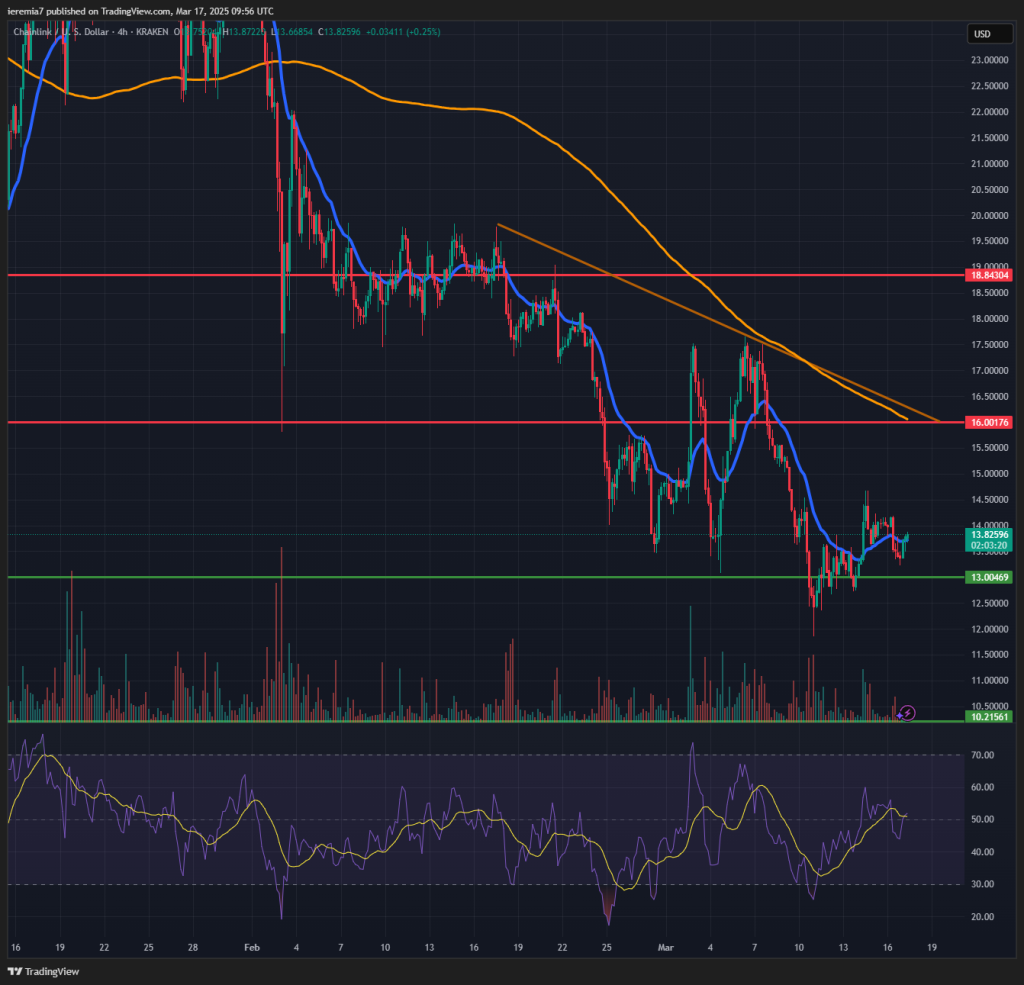
Similar to Ether, Chainlink is also bouncing from the lows and seems to be poised for some more gains this week. Dips are being bought, which is a piece of good news for buyers after a couple of weeks of relentless selling.
Our first key support area is $13 and as long as the price stays above it, we think LINK could move up towards $16. That’s a place where a series of resistance points overlap, including a bearish trend line and the 4h chart 200 SMA. It’s also close to the Feb 2 flash crash low, meaning the market should pay close attention to that area if the price gets to it.
To do downside, we shift to a bearish stance if selling resumes and the price is unable to hold above $13. In that scenario, LINK could weaken towards $10 before finding significant bullish support. Longer term, we remain bearish, but short term, the current correction could extend upward.


There are no comments at the moment, do you want to add one?
Write a comment